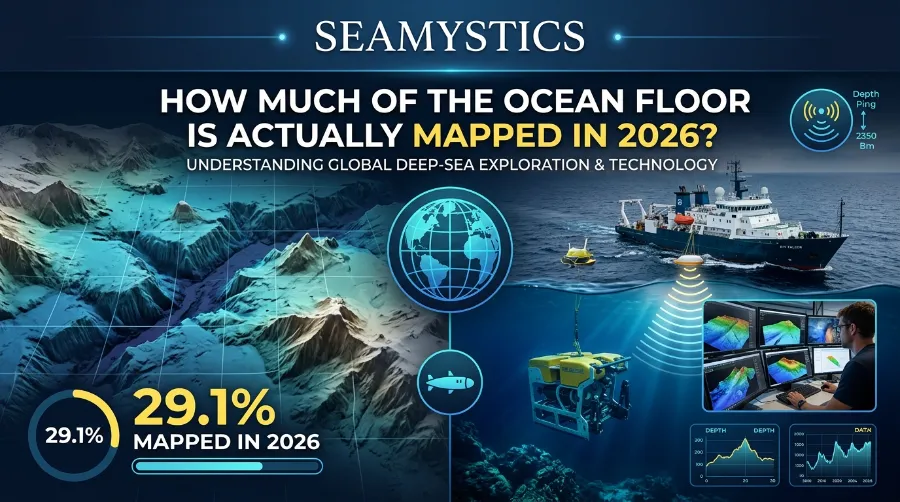

We have sharper photos of Mars than we have of our own seabed. That single fact still surprises people, even marine scientists in training. So how much of the ocean floor is mapped today? And why does a planet covered in 70 percent water still have blank spots on its own map? The honest answer: more than ever before, but nowhere near finished. The gap between “mapped” and “understood” is bigger than most headlines admit.
This matters for reasons far beyond curiosity. Seafloor maps guide submarine cables, tsunami models, fishing regulations, and searches for missing aircraft. An unmapped region isn’t just unphotographed. It’s unaccounted for in nearly every system that keeps ships, cables, and coastlines safe.
Key Takeaways
| Question | Quick Answer |
|---|---|
| Percent seafloor mapped (latest verified figures) | Roughly a quarter of the seafloor meets modern resolution standards |
| Who is leading the effort | The Seabed 2030 Project, a partnership between GEBCO and The Nippon Foundation |
| Main mapping tools | Multibeam sonar from ships, satellite altimetry, and autonomous underwater vehicles |
| Biggest obstacle | Cost and time; deep ocean mapping is slow, expensive, and needs specialized ships |
| Deadline goal | A complete high resolution map of the global ocean floor by 2030 |
TL;DR: As of the most recent published data, roughly a quarter of the world’s ocean floor meets modern mapping standards. That’s up sharply from under 6 percent when Seabed 2030 began in 2017. Ships equipped with multibeam sonar handle most of this work, and satellites fill in the gaps ships can’t reach in time. The 2030 deadline is ambitious. Current progress suggests the project will get close, but full completion isn’t guaranteed.
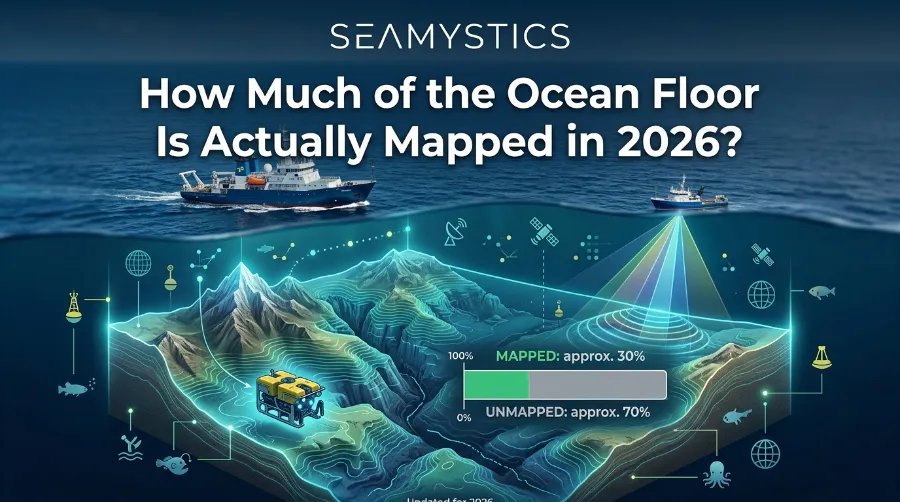
Ocean Mapping Progress: Where We Actually Stand
Let’s start with the number everyone wants: the current percent seafloor mapped. Before Seabed 2030 launched in 2017, teams had mapped only about 6 percent of the global ocean floor using modern, high resolution sonar. By 2023, that number had climbed past 24 percent. By 2024, GEBCO’s published data put it at roughly 26 percent, according to figures reported by Site Selection’s coverage of seafloor mapping efforts.
That climb sounds fast, and in some ways it is. But the pace has slowed as mapping teams move from easier coastal waters into deep, remote basins. Almost no ship traffic crosses these basins. They’re often the hardest part of the entire ocean mapping progress 2026 story: far from ports, deep enough to challenge sonar range, and simply enormous in scale.
Understanding what “mapped” actually means helps explain why this work is so slow. We break that distinction down further in our guide to common ocean myths.
What “Mapped” Actually Means
Not all ocean data counts as a proper map. Older satellite-derived data can estimate seafloor depth at a resolution of roughly 5 kilometers. That’s fine for shipping charts, but useless for finding a shipwreck or planning a cable route. Seabed 2030’s standard requires a resolution closer to 100 to 400 meters, gathered mostly through direct sonar surveys from ships.
This distinction matters. Older maps of “the whole ocean floor” were never truly complete. Scientists stitched them together from low resolution satellite gravity data, similar to sketching a coastline from a plane at 30,000 feet instead of walking it.
The Seabed 2030 Project: Who’s Doing the Work
The Seabed 2030 Project is the closest thing the ocean has to a single, coordinated mapping campaign. GEBCO (the General Bathymetric Chart of the Oceans) and The Nippon Foundation launched it in 2017 with one clear goal: a complete, publicly available bathymetric map of the entire ocean floor by 2030.
A few things set this project apart from past mapping attempts:
- It crowdsources data from research vessels, naval ships, and even private yachts and cargo ships that already run sonar during travel
- It standardizes data from dozens of countries into one shared, open database instead of keeping national surveys siloed
- It prioritizes the deep ocean and polar regions, historically the least mapped areas because they’re the hardest and most expensive to reach
Research vessels like the Scripps Institution of Oceanography’s R/V Sally Ride have contributed directly to this effort. In a firsthand account of a 2016 mapping expedition, the crew described running multibeam sonar continuously during transit legs. They turned ordinary travel time between research stops into usable bathymetric data, a technique detailed in this account of seafloor mapping aboard the Sally Ride. That single habit, mapping while transiting rather than only during dedicated survey time, has become one of the quiet workhorses of the Seabed 2030 project.
Countries and Institutions Leading the Charge
No single nation runs the mapping effort. National hydrographic offices in the United States, the United Kingdom, Japan, and dozens of coastal nations all contribute data, alongside academic institutions and private companies. NOAA’s Office of Coast Survey, the UK Hydrographic Office, and Japan’s Hydrographic and Oceanographic Department all feed data into the shared GEBCO grid.
This international, crowdsourced approach is genuinely unusual for ocean science. Funding and data access are often tightly guarded in this field. That openness explains part of why the percent seafloor mapped has grown so quickly since 2017.
How Ocean Mapping Actually Happens
Multibeam sonar remains the gold standard. A ship-mounted system sends out a fan-shaped array of sound pulses. The time each pulse takes to bounce back reveals depth across a wide swath of seafloor at once, unlike older single-beam systems that produced just one depth reading at a time.
The main tools currently in use include:
- Ship-based multibeam sonar – the most accurate method, but slow and limited to wherever ships actually travel
- Satellite altimetry – measures tiny variations in sea surface height caused by seafloor gravity, useful for rough estimates but far less precise
- Autonomous underwater vehicles (AUVs) and uncrewed surface vessels – reach remote or dangerous areas without risking a crewed ship
- Crowdsourced data from commercial vessels – ferries, cargo ships, and yachts donate their transit sonar data to Seabed 2030
Each method fills a different gap. The combination of tools, not any single technology, has driven ocean mapping progress in recent years. Our piece on ocean salinity trends covers a similar mix of satellite and direct-measurement techniques in a related field.
Why So Much of the Ocean Floor Remains Unmapped
If mapping the ocean floor is this achievable, why isn’t it finished already? A few practical, unglamorous reasons explain most of the gap.
Cost tops the list. A single dedicated mapping expedition can cost tens of thousands of dollars per day once you factor in fuel, crew, and equipment. Multibeam sonar only maps a swath a few times wider than the water is deep. In water 4,000 meters down, that’s a strip roughly 4 to 6 kilometers wide per pass, across an ocean covering more than 360 million square kilometers.
Remoteness compounds the cost problem. The least mapped regions sit furthest from shipping lanes and ports, deep in the Southern Ocean or the central Pacific. A research vessel might travel for a week just to reach the survey site. According to Geography Realm’s overview of seafloor mapping techniques, these remote basins remain among the least surveyed regions on the planet today.
Raw percentages also hide a data quality gap. A region can technically count as “mapped” from a decades-old, low resolution survey, even though it wouldn’t meet Seabed 2030’s current standard. Untangling old, low-quality data from new, high-resolution surveys takes time on its own.
Why a Fully Mapped Ocean Floor Actually Matters
It’s tempting to file ocean floor mapping under pure science curiosity. But the practical stakes are large and immediate.
- Tsunami and earthquake modeling needs accurate seafloor topography to predict how waves will travel and where they’ll hit hardest
- Submarine cable routing for global internet infrastructure depends on detailed maps to avoid unstable seafloor and existing cables
- Fisheries management uses seafloor habitat maps to protect sensitive ecosystems, a topic closely tied to our coverage of ocean fish depletion
- Search and rescue operations, including aircraft and vessel searches, depend directly on how well a region’s seafloor has already been mapped
A fully mapped ocean floor would also reshape our understanding of deep ocean biodiversity. New topographic features regularly turn out to be habitats for previously undocumented species, an idea we explore further in our piece on ocean and land biodiversity.
Ocean Mapping Progress 2026: What’s Realistic by the Deadline
The 2030 deadline is approaching fast. Most people working on Seabed 2030 expect the project to get close to full coverage, though hitting exactly 100 percent on schedule isn’t guaranteed. Progress has been substantial. But the remaining unmapped areas are disproportionately the hardest ones: deep, remote, and expensive to reach.
That doesn’t make the effort a failure. Teams went from 6 percent to roughly a quarter of the seafloor mapped in under a decade. That’s faster than the previous several decades combined achieved. The trajectory matters as much as the exact finish line.
Frequently Asked Questions
How much of the ocean floor is mapped as of the most recent data? Based on the latest published figures, roughly a quarter of the global seafloor meets modern high-resolution standards. That’s up from about 6 percent in 2017.
What is the Seabed 2030 Project? GEBCO and The Nippon Foundation run this joint initiative. Their goal is a complete, publicly available map of the entire ocean floor by 2030.
Why is so much of the ocean floor still unmapped? Mainly cost, distance, and technical difficulty. High-resolution mapping requires ships equipped with multibeam sonar, and the remaining unmapped areas tend to be the most remote and expensive regions to reach.
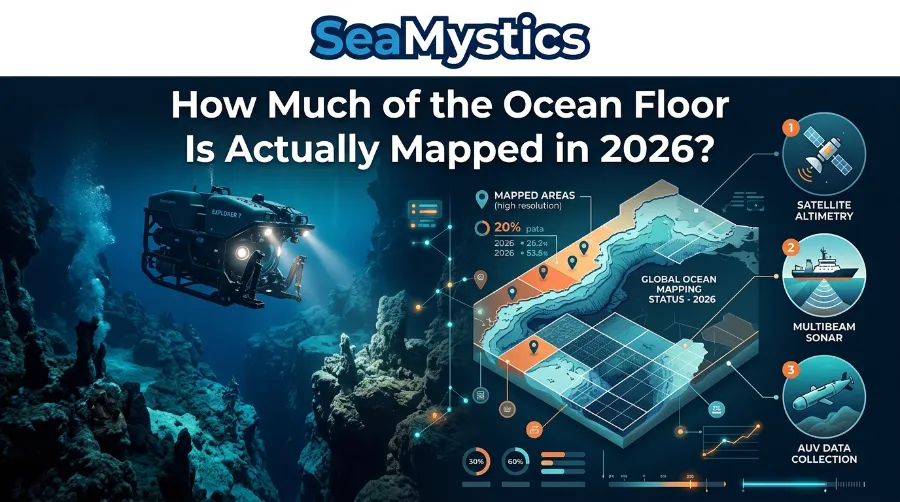
Is satellite data enough to map the ocean floor? No. Satellite altimetry gives useful low-resolution estimates, but it can’t match the detail of direct sonar surveys. That’s why ship-based mapping remains essential.
Will the ocean floor be fully mapped by 2030? It’s possible, but not guaranteed. Progress has accelerated dramatically since 2017. Still, the remaining regions are the most difficult ones left.
A Quick Quiz: Test What You Just Learned
- What percentage of the seafloor had been mapped to modern standards when Seabed 2030 launched in 2017? a) 6 percent b) 25 percent c) 50 percent (Answer: a — 6 percent)
- Which two organizations run the Seabed 2030 Project? a) NASA and NOAA b) GEBCO and The Nippon Foundation c) UNESCO and WWF (Answer: b — GEBCO and The Nippon Foundation)
- What is the primary tool used for high-resolution ocean floor mapping? a) Satellite altimetry b) Ship-based multibeam sonar c) Deep-sea drones only (Answer: b — Ship-based multibeam sonar)
- What is the Seabed 2030 Project’s target completion year? a) 2025 b) 2030 c) 2040 (Answer: b — 2030)
- Why are remote, deep ocean basins the hardest areas to map? a) They’re closer to shipping lanes b) They’re far from ports and expensive to reach with dedicated survey ships c) They don’t require sonar (Answer: b — they’re far from ports and expensive to reach)
Conclusion
Ocean floor mapping in 2026 shows real, measurable progress alongside a still-large gap. Roughly a quarter of the seafloor now meets modern mapping standards. That’s a massive jump from under 6 percent less than a decade ago, and a genuinely international, crowdsourced effort drove it under the Seabed 2030 banner. The remaining work is harder by definition, since teams already finished the easiest, closest, most accessible regions. Whether the full ocean floor gets mapped by the 2030 deadline or shortly after, the bigger story is how much has already changed in a field that spent most of human history working with rough estimates and educated guesses.
References
- Site Selection, “Mapping the Ocean Floor from the Mountains” — https://siteselection.com/mapping-the-ocean-floor-from-the-mountains/
- Geography Realm, “Seafloor Mapping Techniques” — https://www.geographyrealm.com/seafloor-mapping-techniques/
- Scripps Institution of Oceanography, R/V Sally Ride, “Seafloor Mapping the Way Home” — https://rvsallyride.ucsd.edu/2016/08/31/seafloor-mapping-the-way-home/
- GEBCO / Seabed 2030 Project, publicly reported coverage statistics (verify latest figures before publishing)