
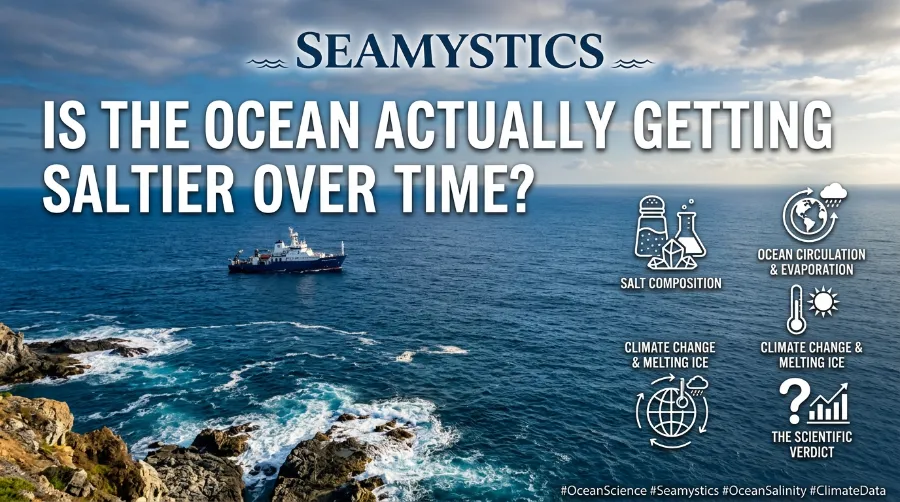
Stand on any beach and taste the spray, and the sea tastes the same as it always has. But underneath that familiar sting, something in the chemistry of our planet’s largest water body is shifting. Ocean salinity trends have become one of the most closely watched signals in climate science, because salt does not lie. It moves with water, and water moves with weather, and weather is changing faster than most of us realize.
For years, the assumption among researchers was simple: a warming planet melts ice, melting ice adds fresh water, and fresh water dilutes the sea. That story held up for decades. Then, around 2015, parts of the Southern Ocean broke the pattern and started getting saltier instead of fresher, catching scientists off guard. So is the ocean actually getting saltier? The honest answer is that it depends on where you look, and that nuance is exactly what this guide unpacks.
Key Takeaways
| Question | Quick Answer |
|---|---|
| Is the whole ocean getting saltier? | No. Some regions, like parts of the Southern Ocean and the subtropical Atlantic, are getting saltier, while others near the poles and rainfall-heavy tropics are getting fresher. |
| When did the biggest shift happen? | A sharp reversal in Southern Ocean surface salinity began around 2015-2016, confirmed by satellite data through 2025. |
| What is driving salinity change ocean patterns? | Mostly the intensifying water cycle: evaporation is increasing in already-salty regions, and rainfall is increasing in already-fresh ones. |
| Does this connect to climate change salinity research? | Yes. Scientists have linked long-term ocean salt content trend data to human-driven climate change since at least 2012, with satellite evidence reinforcing that link through 2025. |
| Why should anyone care? | Salinity affects ocean circulation, marine life, weather patterns, and even the accuracy of climate models. |
TL;DR: The ocean is not uniformly getting saltier. Instead, salty regions are getting saltier and fresh regions are getting fresher, a pattern scientists call salinity amplification. A 2025 satellite-based study also found that the Southern Ocean around Antarctica unexpectedly reversed course after 2015, becoming saltier even as sea ice collapsed. Together, these ocean salinity trends are one of the clearest fingerprints of a changing global water cycle.
What Ocean Salinity Actually Means
Salinity is simply a measure of how much dissolved salt sits in a given amount of seawater, usually expressed in practical salinity units (roughly grams of salt per kilogram of water). Average ocean salinity hovers around 35 psu, but that number swings widely depending on location. A landlocked sea near a hot, dry coastline can sit well above that average, while a river mouth in a rainy region can dip far below it.
Can the Ocean Run Out of Fish? The Data Explained
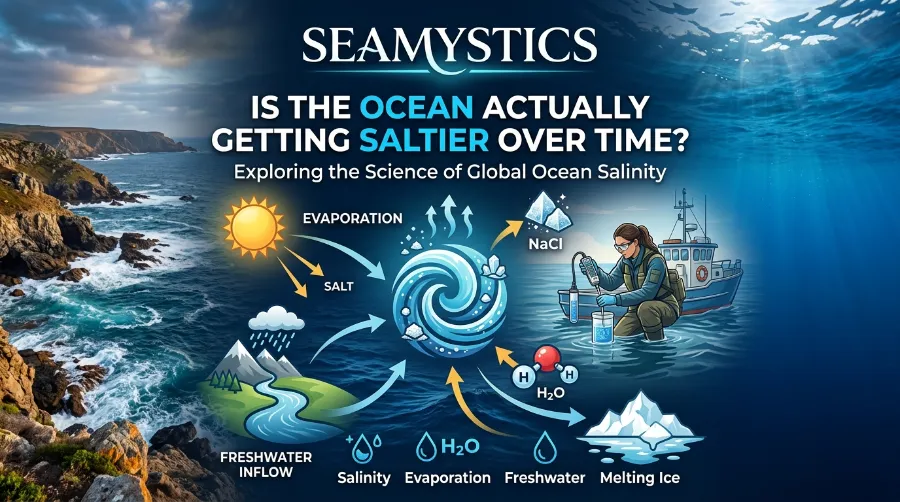
Three forces mostly control this balance. Evaporation removes fresh water and leaves salt behind, so hot, dry, wind-swept regions tend to run saltier. Precipitation and river runoff add fresh water, diluting salinity near coastlines and in storm-heavy latitudes. Ice formation and melt play a role too, since freezing sea ice excludes salt into the surrounding water while melting ice releases fresh water back into the system.
Because evaporation and rainfall are themselves driven by heat, tracking salinity change ocean-wide gives scientists an indirect but remarkably reliable way to watch the global water cycle in action.
So, Is the Ocean Getting Saltier? The Short Answer
If someone wants a one-line answer to give at a dinner party, here it is: the ocean is not getting saltier everywhere, but the pattern of salty-versus-fresh is intensifying, and one region in particular, the Southern Ocean, genuinely has been getting saltier since around 2015.
That single sentence captures what most serious ocean salt content trend research agrees on. The rest of this article walks through the evidence, region by region, so the nuance actually makes sense instead of sounding like a dodge.
The Global Pattern: Salty Gets Saltier, Fresh Gets Fresher
Long-term observational studies going back decades describe what oceanographers call an amplification pattern. Regions that were already salty, such as the subtropical Atlantic between the Bahamas and West Africa, have tended to become saltier still, while regions that were already relatively fresh, such as parts of the tropical Pacific and high-latitude oceans, have become fresher.
A widely cited 2012 study from the Scripps Institution of Oceanography, led by climate researcher David Pierce, found that changes in ocean salinity over the second half of the 20th century were consistent with human-driven climate influence rather than natural variability alone. Pierce’s team compared salinity data against computer models of a warming world and found the two matched closely. The researchers noted that salty ocean regions were experiencing even more evaporation while relatively fresh regions were being further diluted by precipitation, a pattern consistent with an intensifying global water cycle. You can read the original research summary from Scripps Oceanography.
Why Sharks Rarely Attack Humans, According to Data
A more recent modeling study using the UK Earth System Model reinforced this pattern. Researchers found that from 1960 to 2022, the contrast between high-salinity and low-salinity surface regions increased at a rate of roughly 0.12 to 0.17 grams per kilogram per century, depending on whether observational or model-based estimates were used. That is a slow but steady and measurable shift, tracked across more than six decades of data.
The 2015 Southern Ocean Reversal
The most striking recent development in ocean salinity trends research came out of Antarctica. For years, satellite and shipboard data showed the Southern Ocean’s surface water getting fresher while sea ice extent slowly grew, a pattern researchers had grown used to. Then, starting around 2015, both trends flipped at once.
On June 30, 2025, a team led by oceanographer Alessandro Silvano at the University of Southampton published a study in the Proceedings of the National Academy of Sciences describing a “new Southern Ocean state.” Using satellite salinity measurements, the team documented that surface salinity around Antarctica began rising sharply after 2015, at the same time that sea ice extent went into a dramatic decline. Silvano’s team had spent years exploring whether satellites could reliably track salinity from space in the notoriously difficult polar regions, and the resulting dataset gave them a clear enough signal to confirm the reversal was real, not a measurement artifact.
Scientists still do not fully agree on what triggered the shift. Leading explanations include changes in deep ocean mixing that bring saltier, warmer water up to the surface, and altered wind patterns around Antarctica that affect how fresh meltwater spreads. What matters for anyone asking “is the ocean getting saltier” is this: in one of the most climate-sensitive regions on Earth, the answer for the past decade has genuinely been yes.
Do Fish Feel Pain? What Fish Pain Science Actually Shows
For a deeper technical breakdown of how this fits into the broader hydrological cycle, NOAA’s climate science team has published an accessible explainer worth reading via NOAA’s GFDL research blog.
Regional Snapshots: Where Salinity Is Rising and Falling
Because “global average” numbers can hide a lot, it helps to look region by region. Here is a simplified snapshot pulled from recent observational and model-based studies:
- Subtropical Atlantic (Bahamas to West Africa): Among the saltiest surface water on the planet, and getting saltier as evaporation outpaces rainfall in this belt.
- Southern Ocean around Antarctica: Reversed from freshening to salting since roughly 2015, according to the 2025 Southampton satellite study.
- Indian Ocean and adjacent Southern Ocean waters (2005-2023): A 2025 regional analysis using NOAA and European ERA5 climate data found mixed trends, with near-surface salinity decreasing on average by about 0.01 psu per decade across most of the studied area, even as some sub-regions trended saltier.
- Tropical Pacific and high-rainfall zones: Generally freshening, consistent with increased precipitation in already-wet regions.
- Coastal zones near major river systems: Freshening trends tend to dominate here, driven by increased runoff and, in some areas, glacial melt.
How Deep Can Humans Actually Dive Without Equipment?
A Practical Way to Picture the Trend
Figure 1: Simplified Surface Salinity Trend Snapshot (approximate change per decade)
| Region | Approximate Trend | Direction |
|---|---|---|
| Subtropical Atlantic (Bahamas–West Africa belt) | +0.02 to +0.05 psu/decade | Saltier |
| Southern Ocean (post-2015, around Antarctica) | Sharp increase since 2015 | Saltier |
| Indian Ocean & sub-Antarctic waters (2005–2023) | −0.01 psu/decade (average) | Slightly fresher |
| Tropical Pacific rainfall belt | Freshening | Fresher |
| High-latitude coastal zones near rivers/glaciers | Freshening | Fresher |
(Figures are approximate, drawn from the observational and modeling studies cited throughout this article, and are meant to illustrate regional contrast rather than serve as precise real-time measurements.)
Why Ocean Salt Content Trends Actually Matter
It is easy to treat this as an abstract chemistry footnote, but salinity change ocean-wide has real consequences that reach the surface of daily life.
- Ocean circulation: Salinity, along with temperature, drives the density differences that power deep ocean currents, including the Atlantic Meridional Overturning Circulation. Shifts in salinity can slow or reroute these currents over time, which in turn affects regional climate patterns.
- Marine ecosystems: Many species, from coral larvae to commercially important fish, are sensitive to salinity ranges. Rapid local shifts can stress ecosystems that evolved around stable salt levels.
- Weather and rainfall forecasting: Because salinity mirrors evaporation and precipitation, tracking it helps climate scientists cross-check rainfall data gathered from less reliable land-based weather stations.
- Climate model accuracy: Salinity trend data gives researchers an independent way to test whether climate models are correctly simulating the global water cycle, since Scripps researchers have noted it acts almost like a natural rain gauge for the whole planet.
Ocean Myths Debunked: What Marine Science Actually Confirms
How Scientists Actually Measure This
Ocean salinity used to be measured almost entirely by ships and buoys, which left huge gaps in coverage, especially near the poles. That changed with the launch of dedicated satellite missions.
- NASA’s Aquarius satellite, and later the SMAP mission, began measuring sea surface salinity from orbit, giving scientists global coverage that ship-based sampling could never match.
- The European Space Agency’s SMOS satellite added another layer of coverage, and combined SMOS-SMAP datasets are now used in multi-mission salinity products.
- The Argo float network, thousands of autonomous drifting instruments, has quietly built one of the most complete ocean datasets in history since the early 2000s, diving to depth and surfacing to transmit salinity and temperature readings.
Even with all of this technology, polar regions like the Southern Ocean remained genuinely hard to measure accurately from space until relatively recently, which is part of why the 2015 reversal was not fully confirmed and understood until the 2025 Southampton study closed that gap.
For readers who want to see the raw pattern for themselves, Climate.gov’s visual explainer on ocean saltiness and precipitation patterns is a genuinely useful starting point.
The Future of Ocean Exploration: What’s Next After 2026
Common Myths About Ocean Salinity
A few misconceptions come up constantly in comment sections and casual conversation, so it is worth clearing them up directly, especially since some of them tie into broader ocean myths worth debunking.
How Deep Sea Mapping Sonar Actually Works Today
- Myth: The whole ocean is uniformly getting saltier. Reality: trends vary sharply by region, and some areas are freshening.
- Myth: Rising salinity means the ocean is drying up. Reality: total ocean volume is not shrinking from salinity changes; this is about the balance of salt versus fresh water at the surface, not overall sea level.
- Myth: Salinity change is too slow to matter within a human lifetime. Reality: the Southern Ocean shift since 2015 shows changes can happen within a single decade.
- Myth: Melting ice always makes the ocean fresher nearby. Reality: in the Southern Ocean’s recent reversal, sea ice loss coincided with rising, not falling, surface salinity, which is part of why the finding surprised researchers.
Frequently Asked Questions
Is the ocean getting saltier or fresher overall? Neither, uniformly. Ocean salt content trend data shows already-salty regions generally getting saltier and already-fresh regions getting fresher, an amplification pattern tied to an intensifying global water cycle.
When did scientists first notice the Southern Ocean salinity reversal? Researchers began noticing the shift shortly after it started around 2015-2016, but the pattern was confirmed and explained using satellite data in a study published on June 30, 2025.
Does rising ocean salinity affect sea level? Salinity itself does not directly drive sea level rise the way melting land ice or thermal expansion does, though it is closely tied to the same climate processes.
Can ocean salinity trends help predict rainfall patterns on land? Yes. Because salinity mirrors evaporation and precipitation over the ocean, scientists use it as an independent check on rainfall and drought trends, since ocean data averages out a lot of the noise found in land-based weather station records.
Is climate change the main driver of these salinity shifts? Peer-reviewed research dating back to at least 2012 has linked long-term ocean salinity patterns to human-driven climate change rather than natural variability alone, and more recent satellite studies continue to reinforce that connection.
Test Your Knowledge: Ocean Salinity Quiz
1. What is the average salinity of seawater, roughly speaking? A) 15 psu B) 35 psu C) 55 psu D) 75 psu Answer: B) 35 psu
2. Around what year did the Southern Ocean’s surface salinity trend reverse? A) 1995 B) 2005 C) 2015 D) 2022 Answer: C) 2015
3. Which institution led the 2012 study linking ocean salinity changes to human activity? A) Woods Hole Oceanographic Institution B) Scripps Institution of Oceanography C) University of Southampton D) NASA Goddard Answer: B) Scripps Institution of Oceanography
4. What term describes salty regions getting saltier while fresh regions get fresher? A) Salinity collapse B) Salinity amplification C) Salinity inversion D) Thermal drift Answer: B) Salinity amplification
5. Which satellite technology allowed scientists to measure salinity from space? A) Landsat B) Aquarius and SMAP C) Hubble D) GPS-only buoys Answer: B) Aquarius and SMAP
Conclusion
Ocean salinity trends turn out to be far more layered than a simple yes-or-no question. The sea is not uniformly getting saltier, but the balance between salty and fresh regions is shifting in ways that track closely with a warming, more energetic water cycle, and nowhere has that been clearer than in the Southern Ocean’s surprising reversal since 2015. For anyone trying to understand climate change salinity patterns, the takeaway is not alarm but attention: this quiet chemical signal, measured drop by drop across the world’s oceans, is one of the steadiest ways scientists have to check whether their climate models, and their assumptions about our changing planet, are holding up. To dig further into how ocean science separates fact from fiction, explore more research-backed breakdowns over on Sea Mystics, including our related deep dive into ocean circulation and climate.
References
- Silvano, A., et al. (2025). Rising surface salinity and declining sea ice: A new Southern Ocean state revealed by satellites. Proceedings of the National Academy of Sciences.
- Pierce, D., et al. (2012). Ocean Salinity Trends Show Human Fingerprint. Scripps Institution of Oceanography / American Geophysical Union, Geophysical Research Letters. scripps.ucsd.edu
- NOAA GFDL. Surface Salinity Trends. gfdl.noaa.gov
- Climate.gov. Ocean Saltiness Provides Clues to Precipitation Patterns. climate.gov
- Rostov, I.D., Dmitrieva, E.V. (2025). Trends of Changes in Salinity in the Indian Ocean and Adjacent Areas of the South Ocean, 2005-2023.
- NASA Scientific Visualization Studio. Sea Surface Salinity Trend, 2011-2021.