
The Biological Carbon Pump Explained: How the Ocean Moves Carbon to the Deep
Every day, trillions of microscopic plants in the sunlit ocean pull carbon dioxide out of the water and turn it into living cells. Then, when those cells die, get eaten, or get packed into waste, a share of that carbon sinks into the dark. This hidden conveyor is the biological carbon pump, and it is one of the main reasons our air holds less carbon dioxide than it otherwise would. In this guide, I explain how it works in plain words. Along the way, you will see the latest measurements and learn why they matter for people in the United States and Europe.
TL;DR: The ocean’s biological pump is a chain of life processes that moves carbon from the surface to the deep sea. As a result, carbon can stay locked away for centuries. Phytoplankton start the chain, animals and sinking particles carry it, and the deep ocean stores it. However, if this system weakens, more carbon dioxide stays in the air.
Key Takeaways
| Question | Short answer |
|---|---|
| What starts the pump? | Phytoplankton use sunlight and carbon dioxide to grow at the surface |
| How does carbon sink? | Marine snow, fecal pellets, dead animals, and migrating animals |
| How much leaves the surface? | Roughly 5 to 12 billion tonnes of carbon per year |
| How much reaches the deep seafloor? | Often 1% or less of what phytoplankton make |
| How long does deep carbon stay? | Centuries to thousands of years, depending on depth |
| Biggest threats | Warming, stratification, acidification, and changes in plankton and fish |
What Is the Ocean Carbon Cycle?
The ocean carbon cycle is the set of paths that carbon follows as it moves between air, seawater, living things, and sediments. In fact, the ocean holds about 38,000 billion tonnes of carbon, which is roughly 50 times more than the atmosphere. Because of that size, small changes in the sea can shift the climate.
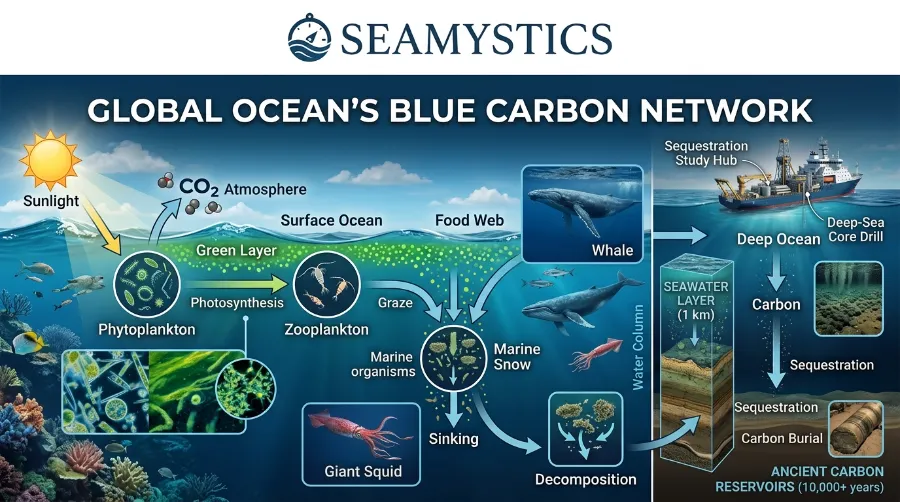
Scientists often split the cycle into three pumps. First, the solubility pump works because cold water dissolves more gas, so carbon dioxide enters the sea at cold, high latitudes and sinks with the water. Second, the carbonate pump involves shell builders such as coccolithophores. Finally, there is the biological pump, which is the star of this article.
In recent years, the ocean has absorbed about a quarter of the carbon dioxide that people release. For example, the Global Carbon Project’s annual carbon budget puts the ocean sink near 2.9 billion tonnes of carbon per year in its latest releases. Meanwhile, human fossil emissions sit around 10 billion tonnes of carbon per year. Clearly, the ocean already does a huge amount of work for us.
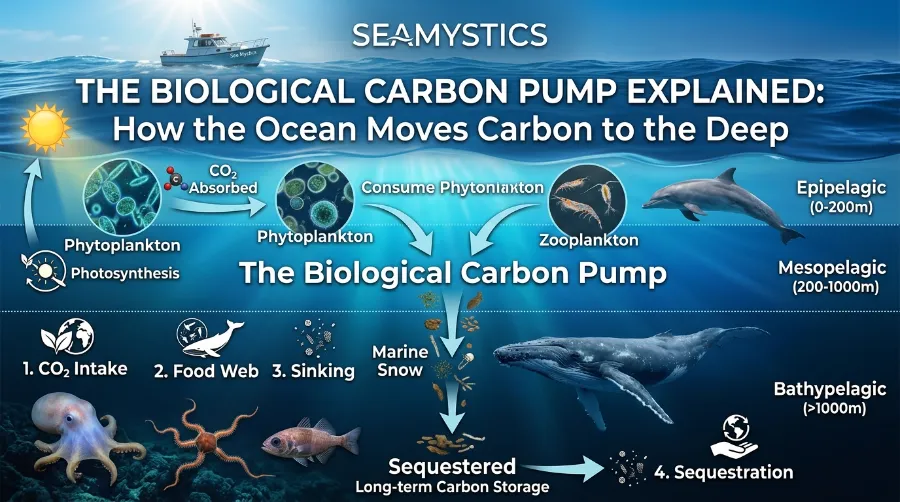
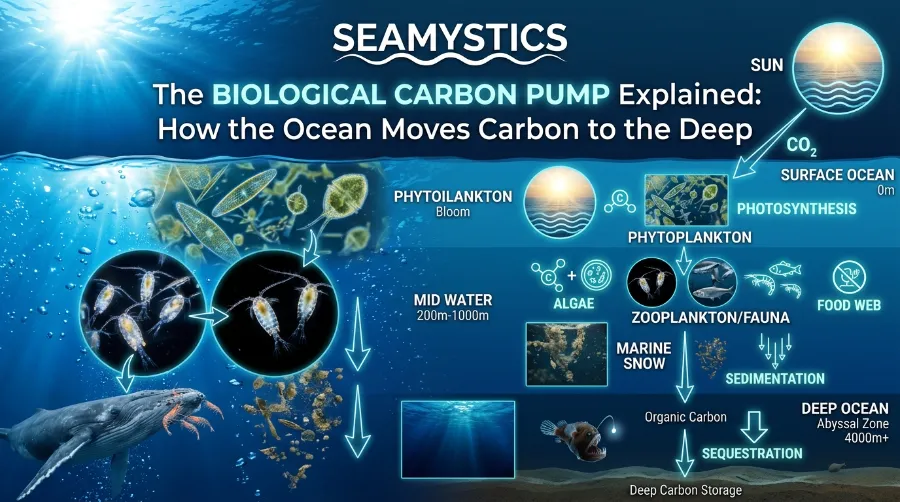
Carbon Pump Explained in Four Simple Steps
If you only remember one section, make it this one. Because the pump runs in four steps, each step has a clear job.
- Capture: Phytoplankton in the top 100 to 200 meters of the sea take in carbon dioxide and sunlight, then turn them into sugars and cells.
- Transfer: Zooplankton eat the phytoplankton. As a result, their waste, along with dead cells and clumps, forms sinking particles.
- Sinking: Particles called marine snow fall through the twilight zone. Meanwhile, animals swim down and carry carbon with them.
- Storage: Some carbon reaches the deep ocean or the seafloor. There, it can stay out of the atmosphere for a very long time.
Notice that each step can fail. For instance, grazers can eat most of the cells at the top. Likewise, bacteria can break the sinking particles down on the way. That is why only a small share of the carbon makes it all the way down.
How the Biological Carbon Pump Works at the Surface
Phytoplankton are tiny, but together they make roughly half of the photosynthesis on Earth. Diatoms, coccolithophores, and cyanobacteria grow wherever light and nutrients meet. In spring, many regions explode with growth, so the blooms become big enough to see from space.
I have watched this change in real time on research cruises. On Monday, a patch of water can look clear blue, but by Friday it can turn a murky green. Under the microscope, that green is a crowded city of diatoms, and many of them are already starting to clump together. If you want to see how these blooms shape the wider food web, read our guide to the phytoplankton bloom ecosystem.
Nutrients limit this growth. Nitrogen, phosphorus, and iron decide where blooms happen and how big they get. In large parts of the Southern Ocean, for example, iron is the missing ingredient even though other nutrients are plentiful. This fact leads to one of the most famous ideas in ocean science, which I cover later.
From Surface to Seafloor: How Carbon Sinks
Carbon does not fall in a straight line. Instead, it rides several different elevators, and each one works at its own speed. Understanding them helps you see why the pump is so hard to measure.
Marine Snow: The Slow Elevator
Marine snow is a shower of dead cells, mucus, fecal matter, and tiny bits of debris that stick together. Most flakes sink tens to a couple of hundred meters per day. At that speed, a flake can take weeks to reach the deep sea, and hungry bacteria eat it along the way.
This loss follows a pattern that oceanographers call the Martin curve, named after work by John Martin and colleagues in the 1980s. According to their data, particle flux drops quickly with depth. Therefore, only about 14% of the carbon that leaves the top 100 meters reaches 1,000 meters. Of course, the real number changes from place to place, so treat this as a rule of thumb.
Fecal Pellets: The Fast Elevator
Many zooplankton wrap their waste into dense pellets. Salps, which are small jelly like animals, make some of the fastest sinking pellets in the sea. In some cases, these pellets drop hundreds to over a thousand meters per day.
Fast sinking matters because speed beats decay. When a pellet falls quickly, bacteria have less time to eat it. Consequently, a salp bloom can send a pulse of carbon far deeper than a regular diatom bloom would.
Diel Vertical Migration: The Living Elevator
Every night, a huge crowd of fish, krill, and squid rises from the twilight zone to feed near the surface. Then, at dawn, they swim back down. While at depth, they release waste and breathe out carbon dioxide, so they move carbon below the surface layer without any sinking particles.
Many people call this daily trip the largest animal migration on Earth. Lanternfish are among the stars of the show. Still, estimates of the total mesopelagic fish biomass vary a lot, from about 1 to 10 billion tonnes, so the amount of carbon they move remains an open question.
Here is a fun link to sonar. During World War II, navy crews saw a false seafloor on their echo sounders that rose at night and sank at dawn. In reality, it was not the bottom at all but this migrating crowd, and you can read a related story in our post on sonar and unidentified shapes.
Big Falls: Whales and Carcasses
When a whale dies and sinks, it delivers a large pulse of carbon to the seafloor in one event. These whale falls can feed seafloor communities for decades. Besides that, fish falls, jellyfish blooms, and large pieces of kelp or wood add to the same pathway.
Large animals also help while they are alive. For instance, whales feed deep and release nutrient rich waste near the surface, which can boost plankton growth. This is a good example of how keystone marine species shape the climate as well as the food web.
Why the Twilight Zone Decides Everything
The twilight zone, or mesopelagic zone, runs from about 200 to 1,000 meters deep. Sunlight fades there, and the water stays cold and dim. Because most sinking carbon gets eaten or breathed back into carbon dioxide in this layer, almost all the action in the pump happens here.
A small change in how fast the zone recycles carbon can have a big effect on the air. For example, models suggest that a shift in the average depth where carbon is released changes how long it stays away from the atmosphere. Carbon released at 1,000 meters can stay out of contact with the air for centuries. In contrast, carbon released at 200 meters may return in decades.
Field programs are working hard to nail this down. Specifically, the NASA and NSF led EXPORTS field campaign tracked carbon through the twilight zone in the North Pacific in 2018 and the North Atlantic in 2021. One lesson from these cruises is that the same amount of surface production can lead to very different export depending on the food web. This finding matches what I see in practice, since two places with similar blooms can have very different pump strength.
Chart: How Much Carbon Survives the Trip Down
The bar chart below is based on the Martin curve rule of thumb. It shows the rough share of the carbon leaving the top 100 meters that remains at each depth.
| Depth | Share remaining | Bar |
|---|---|---|
| 100 m | 100% | ██████████████████████████████ |
| 200 m | 55% | ████████████████ |
| 500 m | 21% | ██████ |
| 1,000 m | 14% | ████ |
| 2,000 m | 8% | ██ |
| 4,000 m | 4% | █ |
Values are approximate and use the standard Martin exponent of about 0.86. In real life, profiles vary by region, season, and plankton type.
The Numbers Behind the Pump
Researchers track the pump with a few key figures. The table below gives a clear snapshot of how big it is. Since the pump is difficult to measure, the ranges are wide.
| Measure | Approximate value |
|---|---|
| Ocean net primary production | About 50 billion tonnes of carbon per year |
| Export out of the surface layer | About 5 to 12 billion tonnes of carbon per year |
| Share of production that is exported | Often 5% to 20%, higher in cold, rich waters |
| Share reaching the deep seafloor | Often 1% or less |
| Effect on air | Models suggest the atmosphere would hold on the order of 200 ppm more carbon dioxide without the pump |
| Total carbon in the ocean | About 38,000 billion tonnes of carbon |
The last figures stand out. Although the pump moves only a small slice of ocean production, it still shapes the whole climate. For this reason, many scientists call it one of the most important natural climate services on the planet.
Blue Carbon Ocean Habitats: A Different but Related Story
People often mix up the open ocean pump with blue carbon. Although the two are related, they are not the same. Blue carbon ocean habitats are coastal systems such as mangroves, seagrass meadows, and salt marshes.
These habitats cover a small part of the sea. Even so, they bury a large share of the carbon that ends up in marine sediments. Because their roots trap carbon in thick, low oxygen mud, it can stay there for centuries. However, when people drain or clear them, much of that carbon returns to the air.
In short, the open ocean pump works at huge scale and depth, while blue carbon works at the coast with very high burial rates per acre. Both matter, and both need protection. To picture it, think of the coast as the carbon bank and the open sea as the carbon highway.
Ocean Carbon Storage: How Long Does It Last?
Ocean carbon storage depends on where the carbon ends up. For instance, carbon in sunlit surface water can return to the air within months. By comparison, carbon below about 1,000 meters usually stays away for hundreds of years. Meanwhile, carbon in deep sediments can stay for millions of years.
Scientists call this idea sequestration time, and it explains why depth matters so much. A tonne of carbon that sinks to 2,000 meters is worth more for the climate than a tonne that stops at 200 meters.
Ocean circulation controls the clock. Eventually, deep water rises back to the surface in other regions, a trip that can take centuries. As a result, a lot of today’s deep carbon left the surface long before the industrial era. That slow turnover is a gift. On the other hand, it also means the new carbon we add stays in the system for a very long time.
What Scientists Have Learned From Experiments
Real data beats theory, so let me share three key cases that shaped the field.
The iron idea (1990). Oceanographer John Martin argued that adding iron to iron poor seas could boost plankton and pull more carbon down. His famous joke asked for half a tanker of iron to start an ice age. After that, more than a dozen open ocean experiments followed over the next two decades.
The EIFEX experiment (2004). In the Southern Ocean, researchers added iron to a patch of water and followed the bloom. Later analysis, published in 2012, showed that a good share of the bloom’s carbon sank to at least 3,000 meters. It remains one of the clearest signs that fertilizing can send carbon deep.
The LOHAFEX experiment (2009). In contrast, a later test in a different region gave a very different result. Grazers ate the new growth quickly, so little carbon sank. This result teaches a vital lesson: the same trick can give opposite results depending on the local food web.
My own view comes from years of reading these results and working with plankton samples. In my opinion, the pump is not a single dial that we can turn. Instead, it is a living system that responds to the whole food web, and that is why I treat large scale fertilization claims with caution.
How Scientists Measure the Pump Today
Measuring a process that spans the whole ocean is hard. Ships give detailed data, but they can only visit a tiny area. Because of this gap, new tools matter so much.
Floats are leading the change. The Biogeochemical Argo program sends autonomous floats that dive to 2,000 meters, measure oxygen, nutrients, pH, and particles, and then surface to send data home. In the long run, the program aims for a global fleet of about 1,000 floats, which would give a steady view of the pump across seasons.
Other tools add to the picture:
- Sediment traps: Funnel shaped devices catch sinking particles at set depths.
- Satellites: They track chlorophyll and estimate surface production from space.
- Underwater cameras: These count and size marine snow as it falls.
- Autonomous gliders and robots: Together, they collect samples and data in places ships cannot reach.
If you want a friendly overview, the Woods Hole Oceanographic Institution offers a clear biological pump video and explainer. In addition, the Ocean Carbon and Biogeochemistry program shares a helpful overview of the biological pump with links to current research. Together, these sources give you a solid base to go deeper.
Is the Biological Pump Changing?
Yes, but the answer is not simple. First, the ocean is warming, and warm water forms stronger layers. These layers can block nutrients from rising, so plankton growth may fall in some regions.
Warming also speeds up bacteria. When bacteria work faster, sinking particles break down earlier, and less carbon reaches the deep. On the other hand, in parts of the polar seas, melting ice may expose more water to light and boost growth.
Acidification adds another unknown. Lower pH can affect shell builders, and shells act as ballast that helps particles sink. Therefore, fewer shells could slow the sinking of some particles, although some studies show mixed results.
To sum up, scientists agree the pump is shifting, but they do not yet agree on the net effect. Different models give different answers. For that reason, long term records and new float data matter so much, and I would be wary of any source that gives a single, confident number for the future.
Human Impacts on the Ocean Food Web and Pump
People affect the pump in many ways. For example, overfishing removes large animals and changes who eats whom. Likewise, bottom trawling disturbs sediments that store old carbon. Pollution and noise add stress to marine life as well.
Fishing in the twilight zone is a rising worry. Some companies have looked at harvesting lanternfish for feed and oil. Since these fish carry carbon down every night, removing them at scale could weaken part of the pump. Still, we do not yet know how much.
All of these threats connect to the wider food web. To see how one change can ripple through every level of the sea, start with our pillar guide on the ocean food chain. There, you will find how tiny plankton, fish, and giant predators depend on each other.
Can We Help the Pump? A Reality Check
Marine carbon dioxide removal is a hot topic right now. Ideas include iron fertilization, growing seaweed and sinking it, and adding minerals to boost alkalinity. Each idea tries to speed up a natural process.
I support research, because we need to know what works. Even so, I ask three questions before I trust any claim. First, does the carbon really reach a depth where it stays? Second, can we measure and verify it? Third, what happens to the rest of the ecosystem?
Today, many of these ideas fail at least one test. For example, the US National Academies called for careful research and strong monitoring in 2022 before any large scale use. In my view, protecting what already works is the best first step. That means healthy fish stocks, intact coastal habitats, and cutting emissions at the source.
Practical Insights From the Field
Here are a few lessons from real work and from the data that I think are worth sharing.
- Size matters more than quantity. A bloom of large, heavy diatoms often exports more carbon than a bigger bloom of tiny cells.
- Timing matters. If grazers wake up late, the bloom has time to clump and sink. By contrast, if they wake up early, they eat most of it.
- Place matters. High latitude seas usually export more than warm, nutrient poor gyres.
- Animals matter. Migrating fish and krill can move a meaningful share of carbon, so models that leave them out often miss it.
Together, these points explain why two seemingly similar blooms can give very different results. They also show why simple rules rarely hold across the entire ocean.
Frequently Asked Questions
What is the biological carbon pump in simple words?
It is the set of living processes that move carbon from the sunlit surface to the deep ocean. First, phytoplankton take in carbon. Then, sinking particles and migrating animals carry it down.
How is the biological pump different from the solubility pump?
The solubility pump depends on physics, because cold water dissolves more gas and sinks. By contrast, the biological pump depends on life: plankton, animals, and the particles they make.
How much carbon does the biological pump move each year?
Estimates of export from the surface range from about 5 to 12 billion tonnes of carbon per year. However, only a small share reaches the deep seafloor.
Why is the twilight zone so important?
Most sinking carbon gets eaten and turned back into carbon dioxide in this layer. Therefore, small changes in this recycling can change how long carbon stays out of the air.
Is blue carbon the same as the biological carbon pump?
No. Blue carbon refers to carbon stored in coastal habitats such as mangroves, seagrass, and salt marshes. In comparison, the biological pump works mainly in the open ocean.
Can the ocean store carbon forever?
Not forever, but deep storage can last centuries to thousands of years. Meanwhile, carbon buried in sediments can last far longer.
Is climate change weakening the pump?
Scientists see signs of change, but the net effect is still uncertain. Warming, stronger layering, and acidification all play a part, and they can push in different directions.
Quick Quiz: Test Your Knowledge
1. Which group of organisms starts the biological pump?
a) Whales
b) Phytoplankton
c) Sharks
2. About what share of carbon leaving the top 100 meters reaches 1,000 meters, based on the Martin curve rule?
a) About 14%
b) About 60%
c) About 90%
3. What is the name for the daily movement of animals between deep water and the surface?
a) Tidal drift
b) Diel vertical migration
c) Coastal upwelling
4. True or false: Blue carbon habitats are mainly found in the deep open ocean.
5. True or false: Fast sinking fecal pellets can help carbon reach deeper water before bacteria eat it.
Answers: 1) b, 2) a, 3) b, 4) False, since blue carbon habitats are coastal, 5) True.
Conclusion
The biological carbon pump is one of the quiet engines of our planet. First, tiny plankton capture carbon at the surface. Then, snow like particles, waste pellets, and nightly animal migrations carry it down into the dark. Thanks to this chain, the atmosphere holds far less carbon dioxide than it would otherwise.
However, the pump is also fragile and still not fully understood. Warming, acidification, and human pressure on ocean life could change it in ways we are only starting to measure. For this reason, the best response is to keep studying it, protect healthy marine food webs and coastal habitats, and cut emissions so the ocean is not asked to do even more. If you remember one idea from this guide, let it be this: a healthy living ocean is a working climate system.
References
- Global Carbon Project. Global Carbon Budget (annual releases).
- Ocean Carbon and Biogeochemistry (OCB). The Biological Pump.
- Biogeochemical Argo. Scientific Questions: The Biological Pump.
- Woods Hole Oceanographic Institution. Ocean Learning Hub: The Biological Pump.
- NASA and NSF. EXPORTS Field Campaign.
- Martin, J.H., Knauer, G.A., Karl, D.M., Broenkow, W.W. (1987). VERTEX: Carbon cycling in the northeast Pacific. Deep Sea Research.
- Smetacek, V. et al. (2012). Deep carbon export from a Southern Ocean iron fertilized diatom bloom. Nature.
- National Academies of Sciences, Engineering, and Medicine (2022). A Research Strategy for Ocean based Carbon Dioxide Removal and Sequestration.