
More than 3,300 kilograms of plastic enter the ocean every minute. So, ocean cleanup technology has a huge job, and many readers ask me if these devices actually work. As a marine biologist, I have read survey data and field reports on this topic for years. In short, the honest answer sits between hype and doubt. Below, I break down the real numbers, the wildlife risks, and the gaps that still need fixing.
TL;DR: Cleanup devices work, but only at a small scale so far. The Ocean Cleanup passed 50 million kilograms removed in March 2026, but rivers still add about 1.15 to 2.41 million tonnes of plastic each year. Therefore, cleanup helps most when it pairs with river barriers, better gear rules, and less plastic production.
Key Takeaways
| Question | Short answer |
|---|---|
| How much plastic has been removed? | About 50 million kg by March 2026 (rivers and ocean combined) |
| How fast is the pace? | Roughly 1.8 million kg per month between Aug 2024 and Mar 2026 |
| How much new plastic enters the sea? | About 1.15 to 2.41 million tonnes per year from rivers |
| Do the devices harm wildlife? | Bycatch is low by mass, but the science is still young |
| What is the stated goal? | Remove 90% of floating ocean plastic by 2040 |
| What is the biggest gap? | Scale, sinking debris, and stopping plastic at the source |
How Ocean Cleanup Technology Works in Plain Words
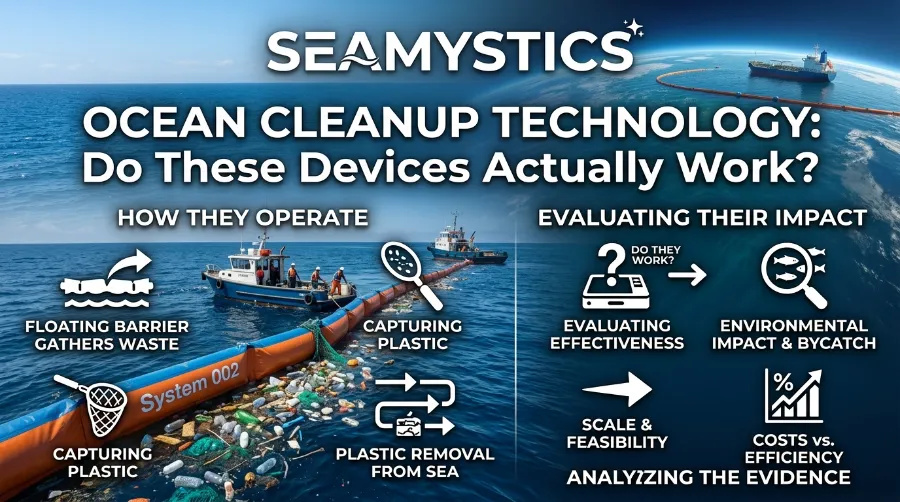
Three ideas sit behind most cleanup systems. First, find where plastic collects. Second, use moving water or moving boats to gather it. Third, pull it out and sort it on land. However, the details change from a river to an open ocean, so let me take each one in turn.
Why the garbage patch is so hard to clean
The Great Pacific Garbage Patch floats between Hawaii and California. According to The Ocean Cleanup, it covers about 1.6 million square kilometers, which is roughly twice the size of Texas. Yet it is not a solid island. Instead, the plastic spreads thin across a huge area.
Here is a detail that surprised many readers. About 92% of the patch’s mass is debris larger than half a centimeter. As a result, most of the weight comes from pieces a net can catch, not from invisible specks. That fact is the main reason floating barriers have a chance.
Microplastics Seafood Research: What the Data Actually Shows
System 03: the floating U-shaped net
System 03 is the current ocean machine. First, two vessels tow a long U-shaped barrier through the water. Then plastic drifts into a retention zone at the back. When the zone is full, the crew takes the end aboard, seals it, and empties it on the vessel.
The group also changed how it aims the system. Since 2024, teams have used computer models to predict plastic hotspots and steer the systems there. Because currents shift, the hotspots move too. In practice, chasing thicker plastic means more catch per hour and less fuel per kilogram. Overall, I see this as the smartest upgrade so far, and I explain why later.
Interceptors: closing the tap in rivers
Rivers carry most of the ocean’s new plastic, so the group also works upstream. Its plan targets about 1,000 rivers that supply 80% of river plastic pollution. The Interceptor is a solar-powered barrier. Specifically, the river’s own current pushes trash onto a conveyor, and the conveyor drops it into dumpsters.
The fleet counted 20 deployments as of May 2025. For example, Interceptor 004 on the Ozama River in the Dominican Republic stopped more than 300,000 kilograms of waste from reaching the sea over five years. Likewise, another unit sits in Ballona Creek in Los Angeles, which matters for readers in the United States. Meanwhile, you can read the group’s own overview on its oceans page.
Ocean Cleanup Project Results: What the Data Shows
Milestones since 2023
Numbers tell the story better than press photos. So here are the milestones I could confirm from the group’s own pages and recent reports.
| Date | Milestone | Scope |
|---|---|---|
| July 2023 | 100,000 kg removed from the Great Pacific Garbage Patch, with independent chain of custody checks | Ocean only |
| August 2024 | Over 16 million kg collected worldwide | Rivers and ocean |
| January 2026 | About 29 million kg came from rivers, per a recent summary | Rivers only |
| March 2026 | 50 million kg captured through global operations | Rivers and ocean |
The pace of removal
Now look at the pace. Between August 2024 and March 2026, the total grew by about 34 million kg over 19 months. That equals roughly 1.8 million kg per month. According to my own back-of-the-envelope math, the pace more than tripled the earlier average. Clearly, that is real progress, and it deserves credit.
Coral Restoration Projects: How Scientists Are Regrowing Reefs
Why independent checks matter
One trust point matters here. The group says its catch numbers follow an independent chain of custody standard from DNV. Because of this, each kilogram must come from the water. Independent checks like this separate a serious project from a marketing story.
Ocean Cleanup Effectiveness: An Honest Scorecard
Removal versus yearly inflow
Let me put two numbers side by side. The Ocean Cleanup’s own figures say 1.15 to 2.41 million tonnes of plastic enter the ocean each year from rivers. Meanwhile, the group has removed about 50,000 tonnes in total. So all the plastic removed to date equals roughly 2% to 4% of a single year of river inflow. The Ocean Cleanup
Here is a second way to see it. At 3,300 kg per minute, the sea takes in about 1.73 million tonnes a year. In other words, the entire 50 million kg haul equals about 10.5 days of that flow. I ran these numbers myself, and I share them often when readers ask if the problem is “solved.” It is not, and the group never says it is.
What works well
However, the gap does not mean the devices fail. Instead, it means they fight a flood with a bucket that keeps getting bigger. Here is what works:
- The machines catch real plastic, and independent audits back the weights.
- Hotspot targeting raises the catch per trip.
- River Interceptors stop plastic before it spreads and breaks into smaller pieces.
- Teams track recovered material, so the trash does not just move to a landfill without a plan.
What falls short
Still, several limits remain. For instance:
- The total is small next to yearly inflow.
- Surface systems cannot reach plastic that sinks or settles on the seabed.
- Microplastics are too small for barriers, so they stay in the water.
- Each trip burns fuel, so teams must keep proving the net benefit.
How I judge the results
The group’s stated aim is to clean up 90% of floating ocean plastic by 2040. Its own plan says the pace depends on how many systems it deploys. Even at the newer pace of about 21 million kg a year, cleanup removes only about 1% to 2% of one year’s river inflow. Therefore, growth alone will not close the gap, and source control has to do the rest.
After reading many cleanup reports, my view is simple. Judge these machines by cost per kilogram, wildlife impact per kilogram, and share of the problem removed. Tonnage alone can mislead you. In addition, the group says a full patch cleanup could cost around $7.5 billion, so cost per kilogram will decide how far this scales.
Plastic Collection Devices Ocean Projects Use Beyond One Machine
Different tools for different places
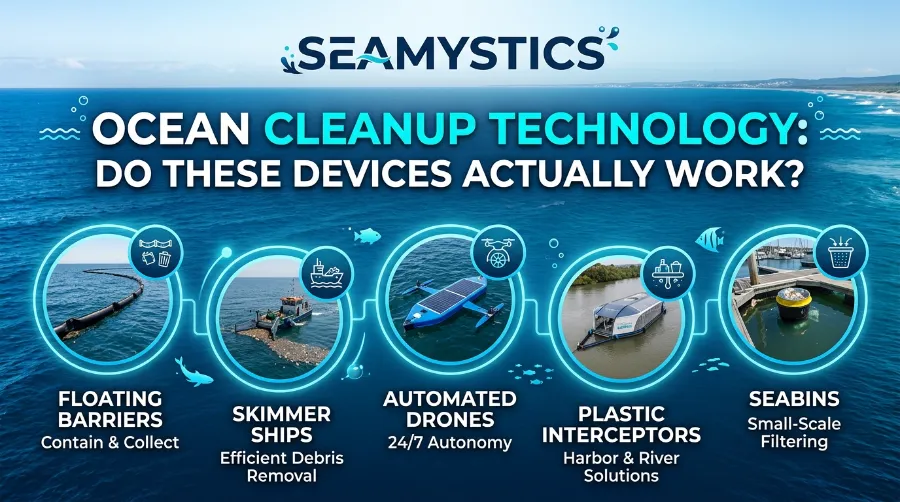
The Ocean Cleanup gets the headlines, but it is not the only option. A busy river mouth in Baltimore has little in common with the middle of the Pacific. So cities and researchers use several types of plastic collection devices in the ocean and in the waterways that feed it.
| Device type | Best place to use it | Main strength | Main limit |
|---|---|---|---|
| Towed floating barrier (System 03) | Open ocean gyres | Reaches remote plastic | High fuel and crew cost |
| River Interceptor | Polluted river mouths | Stops trash early | Needs local waste systems |
| Trash wheel (Baltimore’s Mr. Trash Wheel) | Urban streams and harbors | Uses solar and water power | Works only in one spot |
| Bubble barrier | Canals and slow rivers | Catches plastic without blocking boats | Site specific |
| Beach and shoreline cleanups | Coasts | Low tech and community driven | Labor heavy |
The faucet and mop approach
Notice the pattern. Tools placed close to the source usually cost less per kilogram. On the other hand, tools placed far offshore cost more, but they reach plastic no one else can. As a result, the best plan uses both. I call this the “faucet and mop” approach, and I use it in every talk I give.
Marine Protected Species Laws: What’s Actually Protected in the US
Also, if you want more on tools that reach the seabed, look at how robots and deep-sea vehicles now map litter far below the surface. Surface nets will never see that debris.
Garbage Patch Cleanup Tech and the Wildlife Question
Why neuston matter
Here is the concern I hear most from fellow biologists. Does a giant net harm the animals that live at the surface? Those animals are called neuston. They include tiny drifting creatures such as blue buttons, by-the-wind sailors, and violet snails. Since many of them float where plastic gathers, the worry is fair.
What the newest studies found
A 2023 study from The Ocean Cleanup found that plastic and neuston do not match one to one. Therefore, removing 90% of plastic would not remove 90% of neuston. That result supports the earlier baseline work in Frontiers in Marine Science, which asked scientists to weigh bycatch harm against the benefit of removing plastic.
More recent data adds detail. A 2026 study in Scientific Reports reviewed three years of operations. It found the mass of bycatch was very low compared with the mass of plastic, with a typical ratio around half a percent. Similarly, an earlier 2025 impact assessment found that fish made up about 84% of incidental catch by count. Over 99% of those fish carried an IUCN status of Least Concern.
What I still want to see
Low bycatch is good news. Still, I want three things before I call any system safe:
- Independent teams should repeat the counts, not only the operators.
- Reports should track rare and vulnerable species separately.
- Crews should publish release rates for animals caught alive.
Also, fuel matters. Every tow burns diesel, and diesel adds carbon. The group says it aims to offset operational emissions and to run a full cost-benefit assessment. That is the right promise. However, I will believe it when the full accounting appears in a peer-reviewed paper.
Ghost Nets: The Silent Killers Drifting Through the Deep Ocean
Why ghost nets matter so much
Some of the deadliest trash in the ocean is not a bottle or a bag. Instead, it is fishing gear. A well-known 2018 study of the Great Pacific Garbage Patch found that fishing nets made up at least 46% of the floating mass. In fact, crews on the mothership have hauled up nets so large that they fill parts of the deck.
Fishers often call these lost nets ghost nets. They keep catching fish, turtles, seals, and sharks long after a boat lost them. Because nothing stops them, they can fish for years. I explain the full life cycle in our guide to ghost fishing gear, so it is worth a read if this topic is new to you.
What cleanup can and cannot reach
Here is the catch for cleanup technology. Many nets float, so a surface barrier can catch them. Others, however, sink and settle on reefs, wrecks, and the seabed. Surface systems never see those. So a headline that says “we removed a net” hides a bigger problem below the waves.
Ghost gear also links to other harms. For example, sharks tangle in lost lines, and they face separate pressure from finning. Our breakdown of the shark finning impact shows how many threats stack up on the same animals. In addition, illegal boats rarely mark gear or return to retrieve it. That is why our report on the illegal fishing impact matters for anyone tracking lost nets.
Why prevention beats retrieval
Here is the practical lesson from my work. Prevention costs far less than retrieval. Gear marking, port reception for old nets, and fair rules for every fleet all cut losses at the start. By contrast, chasing nets across the Pacific costs fuel, time, and money. Therefore, I always push for prevention first and cleanup second.
Why Cleanup Devices Cannot Work Alone
Source control comes first
I do not want this guide to sound negative, because cleanup has real value. Old plastic will not vanish by itself. In fact, sun and waves break it into smaller pieces that are almost impossible to remove. So pulling large items out early is smart.
Still, no amount of net can beat a faucet that stays wide open. The Ocean Cleanup says this itself. Besides its ocean work, it runs river projects and has pushed for a Global Plastics Treaty to cut the flow at the start. You can see that dual strategy on its main site.
Laws and industry gear
Rules matter too. Countries protect certain species, restrict harmful gear, and set penalties for dumping. For instance, our overview of marine species laws shows how legal protection and cleanup support each other. After all, a turtle freed from a net still needs a law that keeps it safe once it swims away.
Farming and fishing sectors also carry a share. Ropes, cages, floats, and lines wear out and drift away. Likewise, our pillar guide on aquaculture sustainability facts looks at how the industry can cut its own gear loss.
How to Judge Any Ocean Cleanup Claim in 5 Steps
Big claims spread fast, so a quick checklist helps. I use these steps every time a new project appears in my inbox.
- Check the source. Look for the group’s own data plus at least one independent study.
- Look at the scale. Compare the tonnes removed with the yearly inflow, not with a single beach.
- Ask about wildlife. Search for bycatch numbers and peer-reviewed impact studies.
- Follow the plastic. Find out where the trash goes after it leaves the water.
- Read the cost. Cost per kilogram and fuel use show whether the plan can grow.
If a claim passes all five, I take it seriously. However, if it fails two or more, I wait for better evidence.
Frequently Asked Questions
Do ocean cleanup devices really work?
Yes, they collect real plastic, and audits confirm the weights. However, the total is small compared with yearly inflow, so they solve only part of the problem.
How much plastic has The Ocean Cleanup removed?
The group reported 50 million kilograms in March 2026. That count includes rivers and the Great Pacific Garbage Patch together.
Can cleanup technology remove microplastics?
Not well. Barriers catch larger pieces, and most of the patch’s mass comes from those larger pieces. Meanwhile, microplastics stay spread through the water and are very hard to gather.
Do cleanup nets harm sea life?
Recent studies report low bycatch compared with plastic mass. Still, scientists call for more independent monitoring, especially for rare species.
What is the best way to stop ocean plastic?
Stop it at the source. That means less single-use plastic, better waste systems, and stronger gear rules. After that, cleanup can handle the plastic that already sits in the water.
Conclusion
So, does ocean cleanup technology work? Yes, it pulls real plastic from real water, and the pace has grown fast since 2024. However, the total still equals only days of yearly inflow, and sinking nets and microplastics remain out of reach. Therefore, the smartest path uses the faucet and the mop together: close the tap in rivers, clean the hotspots at sea, and protect wildlife with strong rules.
If you care about the ocean, start with small habits and keep asking for data. Good questions push every project to prove its results. That is how real progress happens.
Quick Quiz: Test What You Learned
1. What is the target The Ocean Cleanup set for 2040?
A) Remove all plastic from the deep sea
B) Clean up 90% of floating ocean plastic
C) Stop all fishing in the Pacific
2. Which device is built for rivers?
A) System 03
B) Interceptor
C) Bubble trawl
3. About how much of the patch’s mass is made of pieces larger than 0.5 cm?
A) 9%
B) 45%
C) 92%
4. True or False: Nets on the surface can reach every ghost net in the ocean.
5. True or False: Recent studies suggest cleanup bycatch is low compared with the mass of plastic removed.
Answers: 1) B, 2) B, 3) C, 4) False, because many nets sink and settle on the seabed, 5) True.
About the Author
Dr. Rabica is a marine biologist with a PhD in Marine Ecology and 20 years of experience in ocean plastic and fisheries research. She writes for Sea Mystics to turn hard science into clear guides for readers in the United States and Europe.
References
- The Ocean Cleanup, Oceans: https://theoceancleanup.com/oceans/
- The Ocean Cleanup, Home: https://theoceancleanup.com/
- The Ocean Cleanup, The Great Pacific Garbage Patch: https://theoceancleanup.com/great-pacific-garbage-patch/
- The Ocean Cleanup, Milestones: https://theoceancleanup.com/milestones/
- The Ocean Cleanup, Neuston in the Great Pacific Garbage Patch: https://theoceancleanup.com/updates/neuston-in-the-great-pacific-garbage-patch-and-the-impact-of-cleanup/
- The Ocean Cleanup, First 100,000 kg removed: https://theoceancleanup.com/updates/first-100000-kg-removed-from-the-great-pacific-garbage-patch/
- The Ocean Cleanup, Staying with the flow (Interceptor update): https://theoceancleanup.com/updates/staying-with-the-flow-changes-to-interceptor-solutions/
- Sainte-Rose et al., Scientific Reports (2026): https://www.nature.com/articles/s41598-026-40859-y
- Evaluating the environmental impact of cleaning the North Pacific Garbage Patch, Scientific Reports (2025): https://www.nature.com/articles/s41598-025-00619-w
- Neuston study, Frontiers in Marine Science (2021): https://www.frontiersin.org/journals/marine-science/articles/10.3389/fmars.2021.626026/pdf