
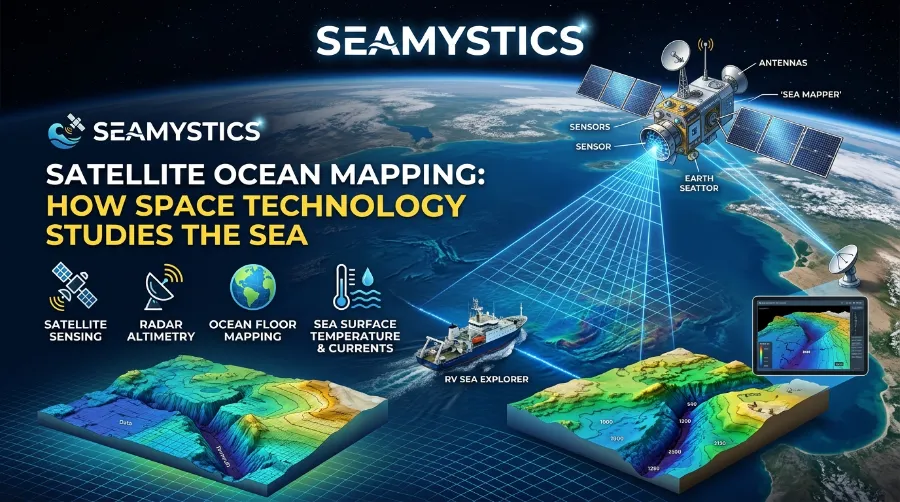

Right now, a satellite is passing over the ocean and measuring the height of the sea to within a few centimeters. It never touches the water. It never sees a ship. Yet it can tell us where a giant eddy is spinning, how fast sea level is rising, and where a hidden mountain sits on the seabed. That is the power of satellite ocean mapping, and it has changed how I work as a marine biologist. I used to wait weeks for ship data. Now I check a map from orbit before I pack my boat.
TL;DR: Satellite ocean mapping uses radar, light sensors and gravity clues to measure sea height, plankton, temperature and seafloor shape from space. Missions like NASA’s PACE, the SWOT satellite and Sentinel-6B now give scientists a near daily view of the whole ocean. Sea level rise has doubled to about 4.5 millimeters a year, and only 28.7% of the seafloor is mapped to modern standards.
Key Takeaways
| Topic | What to know |
|---|---|
| Best tool for sea level | Radar altimeters, with a record that started in 1992 |
| Best tool for plankton | NASA PACE, launched February 8, 2024 |
| Best tool for small eddies | SWOT, launched December 16, 2022 |
| Sea level speed | About 2.1 mm a year in 1993 and about 4.5 mm a year in 2024 |
| Seafloor mapped | 28.7% in 2026, up from 6% in 2017 |
| Biggest limit | Satellites read the surface, not the deep water |
What Satellite Ocean Mapping Actually Measures
Satellite ocean mapping sounds like one tool, but it is really a toolbox. Each tool reads a different clue from the sea surface. Then scientists turn those clues into maps of height, color, heat and even gravity. In short, ocean monitoring from space works because the sea changes the light, radio waves and gravity signals that reach a satellite.
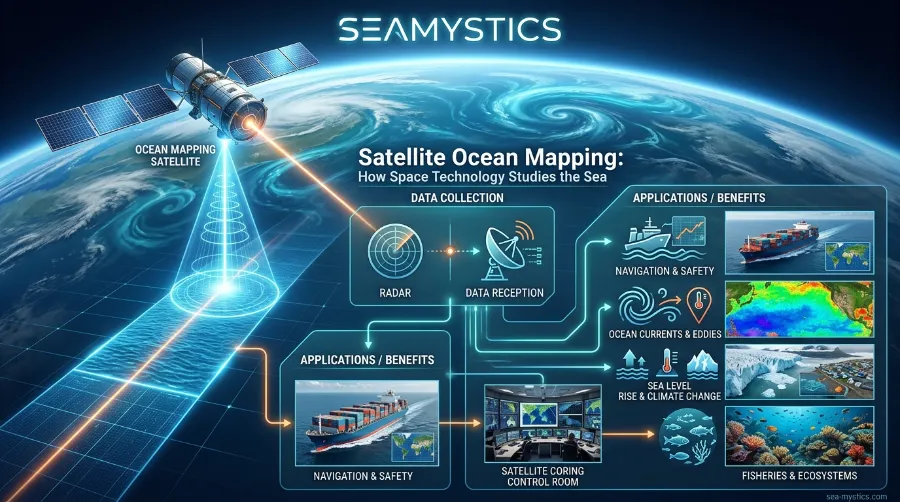
Let me walk through the three groups I use most. I compare each one with what I see from a boat, and that habit has saved me from many wrong conclusions.
Sea Surface Height
Radar altimeters do the heavy lifting here. According to NASA’s Sentinel-6B mission summary, an altimeter sends a radar pulse to the ocean every second and times how long the echo takes to return. Because the timing is so exact, the height of the sea comes out very precise. The Sentinel-6 Michael Freilich mission, for example, can detect changes of about 2 centimeters, based on the briefing that Space.com covered in 2020.
The Five Deeps Expedition: Diving to the Bottom of Every Ocean
Height also reveals currents. When water moves from one place to another, it tilts the surface, and scientists read that tilt to work out the flow. That is why a plain height map can show heat, nutrients and carbon moving around the planet. So one simple measurement feeds many kinds of satellite ocean data.
Ocean Color
Phytoplankton are tiny drifting plants, and they change the color of the water. Productive water looks green, while less productive water looks blue, as NOAA explains in its notes on PACE. Satellites measure that color and turn it into maps of chlorophyll. Those maps help track harmful algal blooms and guide fisheries.
The newest sensor goes further. NASA’s PACE Ocean Color Instrument reads light from ultraviolet at 315 nanometers to near infrared at 895 nanometers, and the mission team says it can identify phytoplankton types from space for the first time. Older sensors mostly told us how much green was in the water. PACE tells us which kinds of plankton make up that green.
Temperature, Wind and Gravity
Infrared and microwave sensors read the temperature of the sea skin. Radar reads how rough the surface looks, and that roughness tells us the wind speed. Meanwhile, gravity leaves its own mark. Large seafloor features pull water toward them, so the sea surface bulges by a tiny amount above a seamount. I cover that trick in the seafloor section below.
In my experience, no single layer tells the full story. Height shows me where water moves, color shows me where food grows, and temperature shows me where fronts form. When all three line up, I know where to look for feeding seabirds and fish. When they disagree, I slow down and check the data quality first.
NOAA Ocean Exploration: What the Agency Actually Discovers Each Year
NASA Ocean Satellites and Their European Partners
Most NASA ocean satellites do not fly alone. Almost every major mission is a team effort with France, Canada, the UK or the European Space Agency. For readers in the United States and Europe, that means the same free data serves both sides of the Atlantic. Here is a quick comparison I built from mission pages at NASA, ESA and NOAA.
| Mission | Launch | Main job | Partners | Key figure |
|---|---|---|---|---|
| TOPEX/Poseidon | 1992 | Started the sea height record | NASA, CNES | Record start |
| Sentinel-6 Michael Freilich | November 2020 | Reference sea level mission | NASA, ESA, EUMETSAT, NOAA | About 2 cm height detail |
| SWOT | December 16, 2022 | Two dimensional sea height, eddies, seafloor clues | NASA, CNES, CSA, UK Space Agency | 120 km swath, 21 day repeat |
| PACE | February 8, 2024 | Plankton, clouds, aerosols | NASA | 315 to 895 nm light |
| Sentinel-6B | November 2025 | Extends the sea level record | NASA, NOAA, ESA, EUMETSAT, CNES, European Commission | Record nears 40 years |
PACE: Reading the Ocean’s Colors
NASA launched PACE on February 8, 2024, and the mission now gives scientists daily views of plankton, clouds and airborne particles. You can follow updates on the PACE mission blog. One post from September 14, 2026 shows that the full size structural test model of the spacecraft now sits at the Smithsonian’s Udvar-Hazy Center in Virginia. It is a nice reminder that every satellite starts as engineers testing steel and wiring on the ground.
PACE also does real work for coastal managers. NOAA scientists use it to spot blooms and identify which phytoplankton communities make them up. That detail matters, because some blooms feed fish while others poison them.
SWOT: Seeing Small Eddies
SWOT, short for Surface Water and Ocean Topography, launched on December 16, 2022. NASA and France’s space agency CNES run it, and the Canadian Space Agency and the UK Space Agency helped build it. Its radar interferometer, called KaRIn, does something old altimeters could not. Instead of measuring a thin line under the satellite, it maps a strip about 120 kilometers wide.
A validation study against moored instruments found that KaRIn errors came in two to four times smaller than planned. As a result, scientists can now see swirling eddies and fronts that older satellites blurred out. In Europe, forecasters at Mercator Ocean ran a first test of SWOT data in their global forecast system, published in Geophysical Research Letters in 2026.
Sentinel-6B: Keeping the Sea Level Record Alive
Sentinel-6B launched from California on November 16, 2025 by US time, which was November 17 in Europe. It is the twin of Sentinel-6 Michael Freilich, and it carries a Poseidon-4 radar altimeter plus a microwave radiometer that measures water vapor, as the NASA mission page describes. NASA says the launch stretches the height record, which began in 1992, to nearly 40 years. NOAA, ESA, EUMETSAT, CNES and the European Commission share the work.
Satellite Ocean Data and the Sea Level Story
If you want one number that shows why satellite oceanography matters, use sea level. Altimeters have done the same job since 1992, first with TOPEX/Poseidon and then with the Jason series and Sentinel-6. Because the method stayed consistent, scientists can compare 1993 with 2024 fairly.
Ocean Exploration Trust: Inside Modern Deep-Sea Research Missions
The results are clear. NASA’s PO.DAAC data team reports that sea level rose 11.1 centimeters from 1993 to 2023. The yearly rate climbed from about 2.1 millimeters in 1993 to about 4.5 millimeters by 2024. If the current path holds, the sea will rise another 16.9 centimeters or more over the next three decades.
| Measure | Value |
|---|---|
| Total rise, 1993 to 2023 | 11.1 cm |
| Rate in 1993 | About 2.1 mm a year |
| Rate by 2024 | About 4.5 mm a year |
| Average rate, full record | About 3.3 mm a year, plus or minus 0.3 |
| Projected extra rise, next 30 years | More than 16.9 cm |
Insert Chart 1 here: Global sea level rise rate from satellite altimetry.
Here is my own view after years of reading these reports. The acceleration is the real story, not the average. Many headlines still quote 3.3 millimeters a year, yet a 2024 peer reviewed study calls that single average increasingly misleading. I agree, because a rate that has doubled needs a different plan than a steady one.
Modern Ocean Exploration Technology Explained: The Tools Finding New Life in the Deep
Coastal planners often ask me what the number means for their own town. My honest answer is that the global figure is only a starting point. Local sea level also depends on sinking land, ocean currents and wind. So I always tell them to pair the global altimetry record with a local tide gauge.
Can Satellites Map the Seafloor?
Yes, but not the way most people picture it. A satellite cannot look through deep water with a camera. Instead, it reads clues at the surface that reflect what lies below. That idea sits at the heart of satellite ocean mapping for the seabed.
The Gravity Trick for Deep Water
According to NOAA’s Ocean Service, the ocean surface has broad bumps and dips that copy the shape of the seafloor because of gravity. A giant underwater volcano pulls water toward it, so the sea piles up slightly above it. BBC Science Focus explains the same idea. The slope is too gentle to see from a ship, but a satellite altimeter can measure it.
SWOT sharpened this method. A NASA supported team used SWOT height data to publish one of the most detailed global seafloor maps yet. NASA’s Jet Propulsion Laboratory notes that ships with sonar have surveyed only about 25% of the seabed. One example is Paramount seamount off Ecuador, a feature of the kind SWOT can detect through its pull on the sea surface.
Shallow Water From Landsat
Coastal water needs a different trick, and light does the job. Pixalytics reports that only about 52 percent of coastal waters in the United States are well mapped. Sonar boats and airborne lidar can fill the gaps, but both cost a lot. So scientists at the U.S. Geological Survey built a method that uses Landsat 8 and 9 images to estimate depth.
Tests in Guam, Key West and Puerto Rico showed the method works best in clear water with a bright bottom. There it can reach past 20 meters, and the team says the clearest water may allow more than 50 meters. This matters for coral reefs, because reefs change over time and need regular remapping. Still, muddy water or dense seagrass makes depth harder to read, so I treat these maps as a first pass and never as a final chart.
How Much of the Seafloor Do We Know?
Seabed 2030 keeps the score. In April 2026, the project announced that 28.7% of the ocean floor is now mapped to modern standards, with almost five million square kilometers added in a single year. Only 6% had that status when the project began in 2017. Also, 220 organizations now share data.
| Year | Share of seafloor mapped |
|---|---|
| 2017 | 6% |
| 2019 | 15% |
| 2023 | 24.9% |
| 2024 | 26.1% |
| 2025 | 27.3% |
| 2026 | 28.7% |
Insert Chart 2 here: Share of ocean floor mapped to modern standards.
Progress is real, but the pace must speed up. Nearly three quarters of the seabed still lacks modern data, and 2030 is close. In my view, satellites will not finish the job alone. They guide ships to the right places, and then ships and robots add the detail. I explain those robots in our guide to autonomous underwater vehicles.
Ocean Monitoring From Space: Three Real Case Studies
Case 1: The Record Sargassum Belt
Sargassum shows what ocean monitoring from space does best. This floating brown seaweed forms a huge belt across the tropical Atlantic, and satellites first noticed it in 2011. It has returned every year since, except 2013. In 2025, scientists at the University of South Florida measured a record 37.5 million tons.
In June 2026, the belt ranked second highest in the satellite record, just behind 2025, according to NASA’s Earth Observatory. The Gulf of America (Gulf of Mexico) held 5 million metric tons, nearly double its previous record. The Caribbean also hit record highs. As a result, coastal managers in Florida and the Caribbean got early warning of beach strandings.
Researchers point to warm water, farm runoff and shifting winds and currents. However, they have not settled on one cause. What I take from this case is simple. The satellite gave us the forecast, but people on the beach still had to clean the sand.
Deep Sea Cables: The Hidden Infrastructure Beneath the Ocean
Case 2: Watching Ships That Hide
Satellites also watch human activity at sea. Global Fishing Watch uses satellite imagery and radar to detect fishing vessels longer than 12 meters, which covers about 100,000 vessels. Radar sees through cloud, so it can spot boats that switch off their tracking beacons.
A peer reviewed 2024 study mapped industrial activity at sea with satellite images and deep learning. It found that offshore wind turbines passed oil structures in number in 2021. It also showed how many vessels never appear on public tracking systems, which experts call dark vessels. For a marine biologist, that matters. Fishing pressure that we cannot see is pressure that we cannot manage.
Case 3: Eddies and Storm Swell From SWOT
SWOT’s first Gulf Stream images, shown by France Science, looked like two wide colored strips. Later, a 2025 Nature paper presented the first global measurements of ocean features at the submesoscale. The team was surprised, because the satellite even picked up storm swell with wavelengths of several hundred meters. The onboard software was supposed to filter those signals out.
Why do I care about tiny eddies? Because they can carry larvae, plankton and heat from place to place. If you study where young fish end up, eddies matter as much as the big currents.
Satellite Oceanography Facts Worth Sharing
Here are the numbers I quote most often when I give talks.
- The satellite sea height record began in 1992 with TOPEX/Poseidon.
- Sea level rose 11.1 centimeters between 1993 and 2023.
- SWOT maps a strip about 120 kilometers wide and revisits every 21 days.
- PACE reads light from 315 to 895 nanometers.
- Only 28.7% of the seafloor is mapped to modern standards.
- More than 1,000 remote sensing satellites now orbit Earth, according to Global Fishing Watch.
- The Great Atlantic Sargassum Belt hit a record 37.5 million tons in 2025.
What Satellites Still Cannot See
Satellites are powerful, but they have clear limits. First, they see only the surface layer. Deep water, the twilight zone and seabed animals stay hidden. NASA notes that PACE cannot detect fish or marine mammals directly, although it can view the phytoplankton communities that shape their habitat.
Autonomous Underwater Vehicles: How AUVs Are Mapping the Deep
Second, coasts are tricky. Hydro International notes that standard altimetry becomes unreliable within about 40 kilometers of shore, because land contaminates the radar signal. Third, clouds block optical sensors, so ocean color maps often have gaps. To fill those gaps, scientists add robots, sonar, floats and moorings. Our ocean exploration technology guide shows how these tools fit together.
I have spent about two decades studying marine life, and satellite maps now sit beside my nautical charts on every planning day. Here at Sea Mystics, I write about this technology because I have seen both sides. I have seen a satellite map point me straight to a productive front. I have also seen a cloudy image send me the wrong way. So my rule is simple: never trust one image. I check three days of data and one ground source before I plan a trip.
Alvin Research Submersible and Nautile: Famous Research Submarines Explained
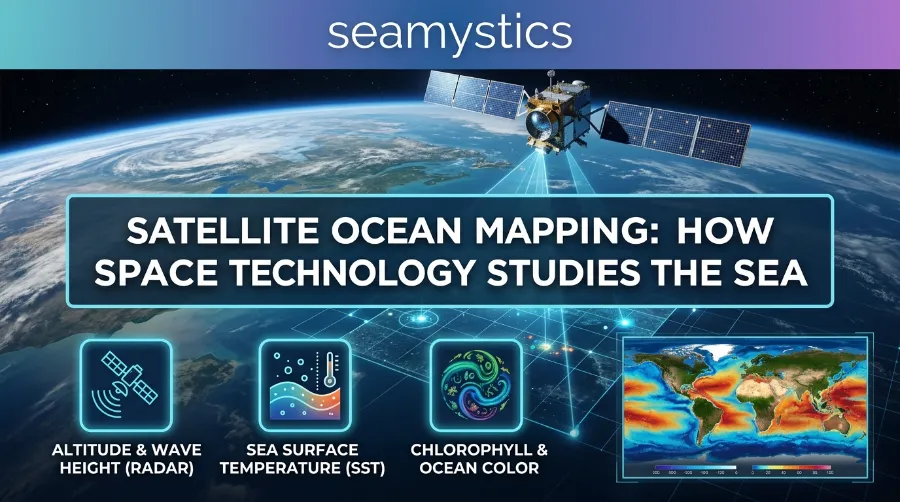
How to Start With Satellite Ocean Mapping Data
You do not need a lab to use satellite ocean data. Most of it is free, and beginners can start in one afternoon. Follow these steps.
- Pick one question. Choose sea level, plankton, temperature or seafloor shape, and stay with that topic first.
- Open a free portal. The PACE data page and the NASA Ocean Data Help Hub offer notebooks for beginners, and the Copernicus Marine Service covers European waters.
- Start with a recent map. Check the date and the cloud cover before you read any colors.
- Compare with a ground source. Use a buoy, a tide gauge or your own water sample.
- Save your settings. Write down the dataset, date and version so you can repeat the result later.
Frequently Asked Questions
How does satellite ocean mapping work?
It uses sensors that read radar echoes, light, heat and gravity clues from the sea surface. Altimeters time radar pulses to measure height, ocean color sensors read plankton, and gravity maps hint at seafloor shape. Scientists then turn those readings into maps.
Which NASA ocean satellites matter most?
PACE studies plankton, SWOT maps small eddies and seafloor clues, and Sentinel-6 Michael Freilich and Sentinel-6B track sea level. NASA runs them with partners such as CNES, ESA, EUMETSAT and NOAA.
Can satellites see the bottom of the ocean?
Not directly in deep water. They read gravity bumps at the surface, and in clear shallow water they can estimate depth from light. Only 28.7% of the seafloor is mapped to modern standards, so ships and robots still supply most of the fine detail.
How accurate is satellite sea level data?
It is very accurate. A single Sentinel-6 measurement detects about 2 centimeters of change, and global averages over a 10 day cycle reach an accuracy of 2 to 4 millimeters, according to Hydro International.
Is satellite ocean data free?
Much of it is. NASA missions like PACE share data openly, Copernicus offers free European ocean products, and Seabed 2030 places its results in the free GEBCO global grid.
Conclusion
Satellite ocean mapping gives us a view of the sea that no ship fleet could ever match. It shows how fast sea level is rising, where plankton and seaweed bloom, and where hidden mountains sit on the seabed. Missions like PACE, SWOT and Sentinel-6B keep adding sharper data every year. Still, satellites read only the surface, so the best results come when space data meets ships, robots and local knowledge. Start with one free map this week, compare it with a ground source, and you will see the ocean in a new way.
Quick Quiz
- In what year did the satellite sea height record begin?
A) 1972
B) 1992
C) 2012 - Which satellite launched on February 8, 2024 and can identify phytoplankton types?
A) SWOT
B) Sentinel-6B
C) PACE - What share of the seafloor was mapped to modern standards in 2026?
A) 6%
B) 28.7%
C) 70% - True or false: Satellites can count individual fish directly from orbit.
- True or false: The yearly rate of sea level rise has roughly doubled since 1993.
Answers: 1) B. 2) C. 3) B. 4) False, because satellites read the surface and phytoplankton, not individual fish. 5) True, from about 2.1 mm a year to about 4.5 mm a year.
References
- NASA Science, “Sentinel-6B Extends Global Ocean Height Record,” 2025
- NASA PO.DAAC, “The rate of global sea level rise doubled during past three decades,” 2025
- Communications Earth & Environment, “The rate of global sea level rise doubled during the past three decades,” 2024
- NASA Jet Propulsion Laboratory, “Next-Generation Water Satellite Maps Seafloor From Space,” 2025
- Seabed 2030 Project, “Global seabed mapping reaches new milestone as five million square kilometres added in a year,” April 2026
- Pixalytics, “Mapping the Ocean Seabed From Satellite,” 2024
- NASA PACE mission site, Ocean Color Instrument page and mission blog, September 14, 2026
- NASA Earth Observatory, “Sizing Up the Sargassum Belt,” 2026
- Global Fishing Watch, “Global Ocean Mapping”
- Space.com, “This new ocean-mapping satellite will help us all understand the impacts of climate change,” October 28, 2020
- NOAA Ocean Service, “How are satellites used to observe the ocean?”
- Hydro International, “Mapping the seafloor with remote sensing and satellite imagery”
- Nature, “Wide-swath satellite altimetry unveils global submesoscale ocean dynamics,” 2025
- “Satellite mapping reveals extensive industrial activity at sea,” 2024