
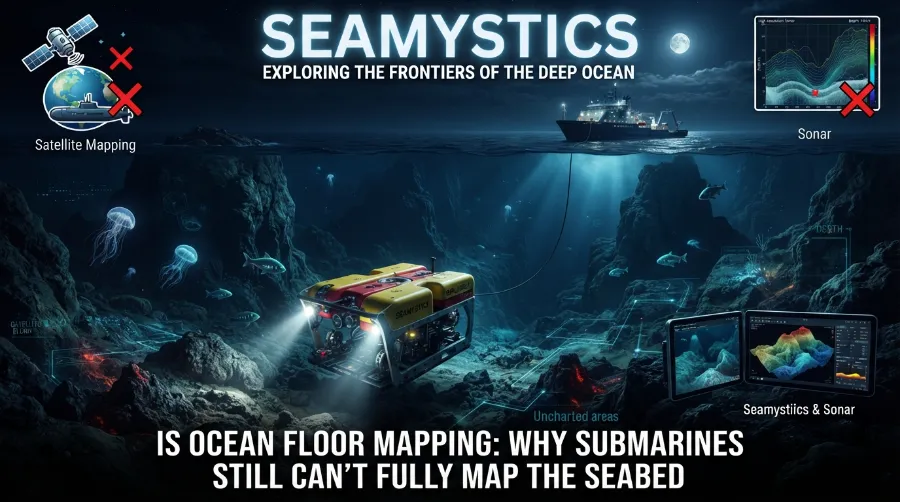

We have better maps of Mars than of the ground under our own oceans. That sounds like a joke, but it is a daily problem for people like me who study the deep. Ocean floor mapping has made huge gains since 2017, yet most of the seabed is still a blank spot at the detail scientists need.
TL;DR: Only 28.7% of the seabed has been mapped to modern standards as of 2026. Submarines are slow, costly, and limited by pressure, darkness, and battery life, so ships, robots, and satellites must share the job. Full coverage by 2030 is unlikely, but the gap is closing every year.
Key Takeaways
| Question | Short answer |
|---|---|
| How much seabed is mapped in 2026? | 28.7%, or about 104 million square kilometers |
| Who leads the effort? | The Nippon Foundation-GEBCO Seabed 2030 Project |
| Why can’t submarines do it alone? | Slow speed, short dives, high cost, and limited sensor reach |
| What works best today? | Ship-mounted multibeam sonar, robot subs, and satellite data |
| Is the 2030 goal realistic? | Probably not in full, but progress is steady |
Why Is So Much of the Unmapped Ocean Floor Still a Mystery?
The ocean covers more than 70% of Earth. Yet most of what lies under it has never been measured in fine detail.
Light and radio waves die out in water. Sunlight fades to nothing below about 200 meters, and radar bounces off the surface. That is why we cannot just point a satellite camera at the bottom and take a picture.
Sound is the tool that works. Water carries sound very well, so nearly every modern map of the seabed starts with an echo.
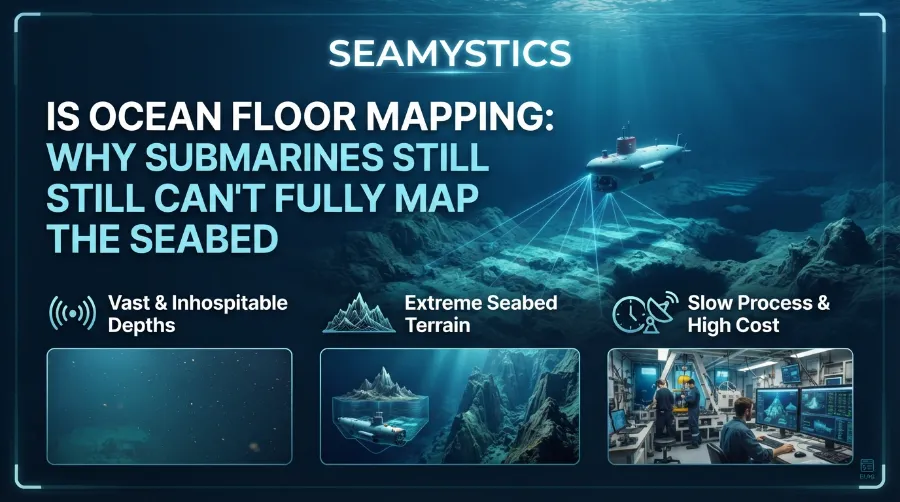
Here is the catch. Sound maps take time, and the ocean is huge. The average depth is close to 3,700 meters, and the deepest spot, the Challenger Deep, sits near 10,900 meters.
The Rogue Wave Phenomenon: Freak Ocean Waves Science Once Doubte
What “Mapped” Really Means
Many people think the ocean already has a full map. It does, but it is a blurry one.
Satellites measure tiny bumps on the sea surface. A big underwater mountain pulls water toward it with gravity, which lifts the surface by a few centimeters. Scientists turn those bumps into a rough picture of the bottom. As an Underwater Technology overview explains, much of the global depth grid is built this way, not from direct measurement.
This is great for spotting large seamounts and ridges. It cannot show a shipwreck, a coral reef, a fault line, or a small canyon.
When researchers say “mapped,” they mean surveyed with modern sonar at a useful resolution. That is the standard Seabed 2030 uses, and it is the one I use too.
The Numbers Behind Ocean Bathymetry Facts
Let me share the latest figures. They show real progress and a large gap.
| Year | Share of seabed mapped | Source note |
|---|---|---|
| 2017 | About 6% | Seabed 2030 launch |
| 2022 | About 20% | UNESCO statement |
| 2024 | 26.1% | World Hydrography Day update |
| 2025 | 27.3% | World Hydrography Day update |
| 2026 | 28.7% | April 2026 announcement |
The April 2026 update added almost five million square kilometers in one year. Seabed 2030’s own announcement says the total now equals about 104 million square kilometers, an area bigger than two thirds of Earth’s land. Data now comes from more than 185 organizations.
Those are strong gains. Still, about 71% of the seabed has no modern survey. At the current pace, the 2030 target of full coverage will be missed. Our team at Sea Mystics covered this timeline in more detail in our 2026 ocean floor mapping progress report.
Chart 1, shown above, makes the climb easy to see. It also shows that each year adds only about one percentage point. That slow pace is the heart of the problem.
Unmapped Ocean Zones: Why Some Deep-Sea Areas Have Never Been Charted
Why Submarines Struggle With Mapping the Seafloor
People often ask me why we do not send a fleet of submarines to finish the job. I wish it were that easy.
Speed and Time
A deep-diving research sub like Alvin moves at a walking pace. It dives for hours, not weeks. Most of that dive time is spent going down and coming up.
Mapping needs steady, long, straight lines. Think of mowing a lawn the size of a continent with a tiny push mower. A submarine can study one small patch in great detail, but it cannot cover large areas fast.
Pressure and Cost
At 4,000 meters, pressure is about 400 times the pressure at the surface. Hulls must be thick, and parts must be tested again and again. A single deep dive can cost tens of thousands of dollars once you count the ship, crew, and support team.
Battery and Navigation
Deep subs carry limited power. GPS does not work underwater, so a sub must track its position with other tools, such as inertial sensors and acoustic beacons. Small errors add up over many hours. In my experience reading survey logs, a map is only as good as its position data. A beautiful picture with a bad location is not much use.
Ocean Nuclear Testing: How Cold War Blasts Changed the Ocean Floor
The Military Factor
Navy submarines do map the seabed to travel safely and hide. That data is usually classified. It does not reach the open GEBCO grid, so it does not help the public map.
How Seafloor Mapping Technology Really Works
The best results today come from a mix of tools. Each one does a different job.
Here are the main methods:
- Ship-mounted multibeam sonar: A ship sends out a fan of sound pulses and listens for echoes. It builds a strip of seabed data as it sails.
- Autonomous underwater vehicles (AUVs): These robots swim close to the bottom without a cable. Closer sensors give sharper images.
- Remotely operated vehicles (ROVs): A cable links them to a ship. They send back video and sonar for small, high-value sites.
- Satellite altimetry: Space-based radar finds seabed shapes from sea surface bumps. It gives a global but rough view.
- Uncrewed surface vessels: Solar and wind powered boats can run mapping lines for months with a small crew on shore.
The R/V Sally Ride’s seafloor mapping log from Scripps gives a nice first-person look at how multibeam works. The ship sends sound pulses, then measures the angle and travel time of each echo. Scientists on board even used a transit home, which added about two days, to collect new data. That kind of “mapping on the way” is a quiet hero of the whole effort.
Sunken City Ruins: Real Underwater Cities Found Beneath the Sea
Why Depth Makes Everything Harder
Multibeam works well in shallow water. In deep water, the sound beam spreads out. The footprint on the bottom grows larger, and the detail gets softer.
That is why shallow coasts are mapped far better than the deep ocean basins. It is also why robots that fly close to the bottom make such sharp maps.
Real Cases Where New Maps Changed What We Know
Numbers are useful, but real stories show why this work matters.
The Blake Plateau Coral Discovery
Off the U.S. East Coast, new sonar surveys revealed a coral habitat across about 6.4 million acres on the Blake Plateau. The result was published in 2024 and tied to the Seabed 2030 update. It showed that major reef systems can hide in plain sight, close to a busy coast. The UNESCO IOC report on the 2024 update covers the finding.
The Factorian Deep
A five-year project mapped huge parts of the Southern Ocean. It found a new deepest point in the region, the Factorian Deep, at 7,432 meters. This shows that even a well-known ocean can hold surprises.
Train Sound Antarctica: The Deep Sea Noise Linked to Icebergs
The Value of Shared Ship Time
Many ships collect sonar data while heading to other research sites. If that data is shared, the map grows at almost no extra cost. I have always told students to turn on the sonar and share the files. It is the cheapest way to add to the global map.
Who Is Doing the Work, and What Is Changing
The map is now a global team project. A guide on mapping the ocean floor from the mountains shows how closely this work ties to coastal planning and business choices. A feature on how technology reveals the deep sea covers the tools in a simple style.
Some notable changes in recent years:
- More countries now share data. In 2025, first-time contributions came from five new countries: Comoros, Cook Islands, Kenya, Mozambique, and Tanzania.
- Companies release old survey data once its business value ends. This adds large areas at no new cost.
- Smaller, cheaper robots are growing in number. They can run alone for long periods.
- Machine learning now helps clean noisy data and speed up map building.
Why Ocean Floor Mapping Matters to Everyday Life
A map of the seabed sounds like a science project. It is more than that.
- Safer shipping: Ships need accurate depths to avoid hazards.
- Tsunami forecasts: Seabed shape changes how waves travel.
- Cable and wind farm planning: Cables and turbines need stable ground.
- Fishing and habitat protection: Reefs, canyons, and seamounts hold marine life.
- Climate models: Seabed shape guides how deep currents move heat around the planet.
Mapping and Marine Debris
Good maps also help with cleanup. Lost fishing gear settles on the bottom, snags on rocks, and keeps killing animals for years. Knowing where the rough terrain lies helps teams plan safer searches. If you want to learn more, read our guide on ghost nets drifting through the deep ocean.
What I Have Learned About Doing This Work Well
After years in marine science, I keep seeing the same patterns. These are practical lessons, not theory.
- Survey lines matter more than gear. A cheaper sonar run in careful, overlapping lines beats a fancy sonar run in a rush.
- Weather ruins data. Rough seas leave gaps. Good planners build in calm-weather windows.
- Metadata is gold. Without notes on tools, dates, and corrections, a dataset is hard to trust or reuse.
- Combine tools. Satellites pick the targets. Ships map the area. Robots zoom in on the best sites.
- Share early. Data in a drawer helps nobody.
These points match what many ocean teams report. They are my own opinions drawn from field practice, and other experts may weigh them differently.
The Devil’s Sea: Japan’s Own Version of the Bermuda Triangle
Will We Ever Finish Mapping the Seafloor?
Honestly, full coverage by 2030 looks out of reach. With a gain of roughly one to one and a half points a year, the finish line is far off.
That does not make the work pointless. Each new square kilometer helps ships travel safely, helps scientists find habitats, and helps us plan for a changing ocean.
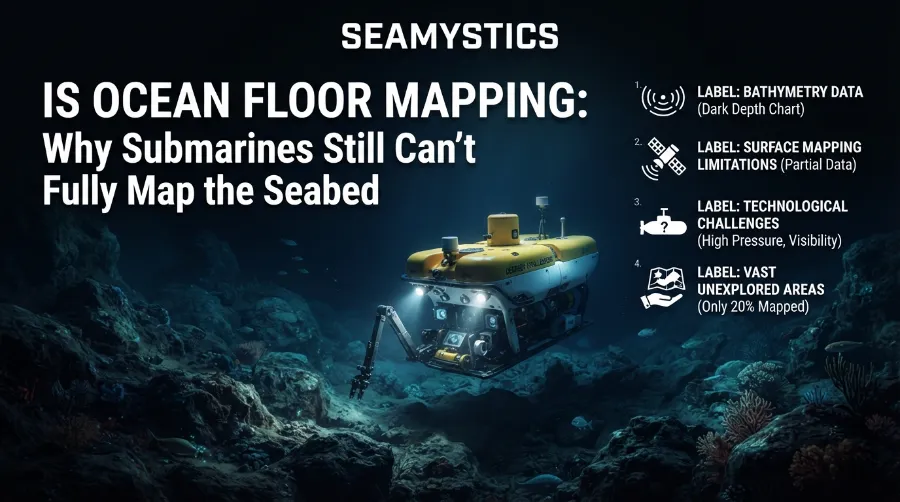
A fair view is this. The first 30% was the easiest. The remaining parts are the deepest, the farthest, and the most costly. Reaching them will take new robots, better funding, and more open data sharing.
Slow Down Sound: NOAA’s Strangest Underwater Audio Recording
What Could Speed Things Up
- Fleets of uncrewed boats that run for months
- More shared ship time on every research trip
- Better onboard data processing
- Stronger national data sharing rules
Discover More Deep Sea Stories
If this topic grabbed you, keep exploring. Read about Sylvia Earle and how she redefined deep diving. You can also see how ROV missions find new deep-sea species every year. For more ocean science, visit the Sea Mystics home page.
Frequently Asked Questions
How much of the ocean floor has been mapped?
As of 2026, 28.7% has been mapped to modern standards, based on the Seabed 2030 update.
Why can’t submarines map the whole seabed?
They are slow, expensive, and limited by pressure and battery life. Ships and robots cover far more ground per day.
What is the best tool for mapping the seafloor?
There is no single best tool. Multibeam sonar on ships covers wide areas, and robots add fine detail.
Is the seafloor really less known than Mars?
For fine detail, yes. Satellites can photograph other planets, but they cannot see through deep water.
Can I see the map myself?
Yes. The GEBCO grid is free and open to the public.
Will the 2030 goal be met?
Full coverage by 2030 is unlikely at the current pace, though progress continues.
Conclusion
Ocean floor mapping is one of the biggest unfinished jobs in science. Submarines are brave and useful, but they are the wrong tool for covering a whole planet’s seabed. The real answer is teamwork between ships, robots, satellites, and shared data.
The numbers tell a hopeful story. We went from 6% to 28.7% in less than ten years. The next 70% will be harder, but every shared survey brings the picture into focus.
Quick Quiz
- What share of the seabed is mapped to modern standards in 2026?
a) 12.4% b) 28.7% c) 55% - Which tool gives the sharpest detail when it flies close to the bottom?
a) Satellite altimetry b) A weather buoy c) An autonomous underwater vehicle - What does most of the global depth grid rely on for areas without sonar?
a) Satellite altimetry b) Aerial photos c) Fishing logs - True or false: Radio waves are the best way to see the deep seabed.
- True or false: Sharing ship sonar data from transit trips can help the global map.
Answers: 1) b. 2) c. 3) a. 4) False, because radio waves fade quickly in water and sound is used instead. 5) True.
References
- Seabed 2030 Project, “Global seabed mapping reaches new milestone,” April 2026
- International Hydrographic Organization, Seabed 2030 update, April 2026
- UNESCO IOC, “Seabed 2030 announces latest progress on World Hydrography Day,” 2024
- UNESCO, “One Ocean Summit: UNESCO pledges to have at least 80% of the seabed mapped by 2030,” 2022
- Ocean News, “Seabed 2030 Announces Millions of Square Kilometers of New Seafloor Data,” 2025
- Underwater Technology, “Underwater Mapping: Multibeam, Seabed 2030 and Conservation,” 2026
- Scripps Institution of Oceanography, R/V Sally Ride blog, “(Seafloor) Mapping the Way Home,” 2016


