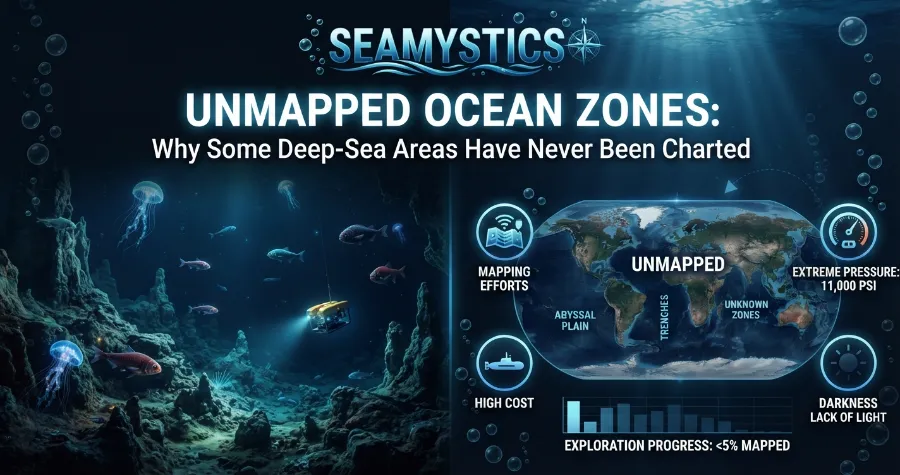

Here is a fact that surprises almost everyone I talk to. We have better maps of Mars than of the floor under our own oceans. Unmapped ocean zones still cover most of our planet, and they sit only a few miles below a ship’s hull. In this guide, I will explain why that gap exists, how big it really is in 2026, and what scientists are doing about it.
Think of the ocean floor as a giant house with the lights off. We know the front porch well, because ships have surveyed the coasts for centuries. The rooms in the back are different. Most of them have never been measured with modern sonar, and a few have never been measured at all.
TL;DR: As of April 2026, only 28.7% of the global seafloor is mapped to modern standards. The rest stays blank because deep water is hard to scan, ships are expensive, and remote regions are rarely visited. At the current pace, the 2030 goal will not be met, but each new survey is changing what we know about deep-sea life and hazards.
Key Takeaways at a Glance
| Question | Short answer |
|---|---|
| How much seafloor is mapped today? | 28.7% (Seabed 2030, April 2026) |
| How much was mapped in 2017? | About 6% |
| What is the main reason for the gap? | Ship time, cost, depth, and distance |
| What do maps without sonar rely on? | Satellite estimates, about 5 km per data point |
| Is the 2030 goal realistic? | Not at the current speed |
| Why does it matter? | Safety, tsunami models, fisheries, cables, and new species |
What “Mapped” Really Means in Ocean Science
When people say the seafloor is mapped, they often picture a clear, detailed picture. That is not what the data shows. A global depth grid covers the whole ocean, but much of it is a guess based on satellites. Satellites cannot see through water, so they measure tiny bumps on the sea surface. A seamount pulls water toward it because of gravity, and the surface rises by a few centimetres.
Scientists read those bumps and estimate what lies below. The method works well for big features, but it is blurry. According to EarthDate, the best satellite maps give about one data point every 5,000 metres. The same source notes that maps of the Moon, Mars, and Venus show features 50 times smaller than that.
True mapping uses sonar. A ship sends sound pulses to the seafloor, and the echo tells us the depth. Multibeam sonar sends hundreds of pulses at once and builds a strip of the bottom as the ship moves. That is the standard that counts as “mapped” in the Seabed 2030 project, and it is why unexplored ocean regions remain so large.
The Rogue Wave Phenomenon: Freak Ocean Waves Science Once Doubted
I like to explain it this way to students. A satellite map is a pencil sketch of a city drawn from an airplane. A sonar map is a street plan with house numbers. Both are useful, but only one lets you find a missing plane or plan a cable route.
How Big Are Unmapped Ocean Zones in 2026?
The numbers have improved, and that deserves credit. When the Nippon Foundation-GEBCO Seabed 2030 project launched in 2017, only about 6% of the seafloor met modern standards. The Seabed 2030 project announced in April 2026 that 28.7% is now mapped. That adds up to about 104 million square kilometres, and almost five million square kilometres were added in the past year.
Even so, that leaves roughly 71% of the ocean floor with no modern, direct measurement. Here is how the progress looks over time.
| Year | Share of seafloor mapped | Source |
|---|---|---|
| 2017 | About 6% | Seabed 2030 launch |
| 2022 | About 20% | UNESCO |
| 2024 | 26.1% | Seabed 2030 grid update |
| 2025 | 27.3% | Seabed 2030 grid update |
| 2026 | 28.7% | Seabed 2030 grid update |
A quick view of the same data as a bar chart:
Chart 1: Share of the seafloor mapped to modern standards
- 2017: ██ 6%
- 2022: ███████ 20%
- 2024: █████████ 26.1%
- 2025: █████████ 27.3%
- 2026: ██████████ 28.7%
- 2030 goal: ████████████████████████████ 100%
The gap between the last bar and the goal shows the problem. Growth is real, but it is slow compared to the size of the task. I will break down the math later in this post.
Why Unmapped Ocean Zones Still Exist
No single reason explains the blank spots. Several problems stack on top of each other. I group them into five main causes.
1. Deep Water Makes Sonar Weaker
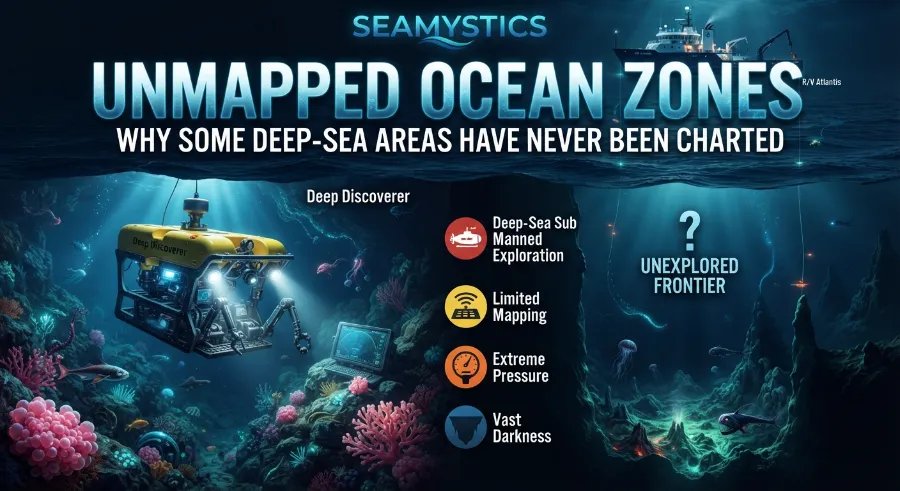
Sound loses strength as it travels. In deep water, the pulse has to go down and come back up, so the echo is faint. To keep detail, the sonar must be close to the bottom. A ship sailing on the surface sees the seabed at a coarser level. EarthDate notes that surface multibeam over 5,000 metres of water gives about 100 metre resolution, similar to current maps of Venus.
Deep trenches add another challenge. Water temperature and pressure change the speed of sound, and surveyors must correct for it. That takes careful calibration and extra time at sea. A rushed survey can produce a wrong depth by tens of metres.
2. Ship Time Costs Too Much
Vessel time is the real limit. A research ship can cost tens of thousands of dollars per day to run. Mapping a large deep area means weeks of slow, straight lines. Few agencies can pay for that without a clear commercial or safety reason.
This is why mapping has grown fastest near coasts and shipping lanes. People pay for charts where boats travel, ports operate, and wind farms or cables are planned. Mid-ocean areas offer little financial return, so they wait.
3. Remote and Icy Places Are Hard to Reach
Some zones are simply far away. The most remote parts of the southern ocean are days of sailing from the nearest port. Sea ice blocks other areas for most of the year. Storms in the high latitudes add weeks of lost time.
Polar waters and mid-ocean basins sit among the thinnest parts of the global grid. A ship needs fuel, crew, and food for a long trip. Then it must hope for calm weather during the few months when the area is open.
4. Data Is Not Always Shared
Many surveys already exist, but they are not public. Oil and gas companies, telecom firms, navies, and fishing fleets collect depth data. Some of it stays private for years or forever. Seabed 2030 asks owners to share it, and over 185 organisations now contribute.
A large part of progress comes from data that already existed and was finally released. Companies often share it once its commercial value is gone. This is a quiet but important trend, and it explains part of the yearly jump.
5. Law and Politics Slow Access
Every coastal country controls its Exclusive Economic Zone, which reaches 200 nautical miles from shore. A foreign research ship needs permission to survey there. Permits can take months, and some requests are denied. Disputed waters make this even harder.
The picture is similar in my field work planning. Before a ship even leaves, teams spend weeks on paperwork. A good survey plan must include the science, the budget, and the diplomacy.
Real Case Studies: When a Blank Map Causes Real Problems
Numbers feel abstract until something goes wrong. These cases show why mapping is not only about curiosity.
Case 1: The USS San Francisco, January 2005. A US Navy submarine was travelling at about 38 miles per hour, 525 feet below the surface, south of Guam. It hit an uncharted seamount. According to EarthDate, 100 of the 137 crew members were injured and one sailor died. Poor charts were a clear factor in the accident.
Case 2: The search for Malaysia Airlines Flight 370, 2014 to 2017. After the plane vanished on March 8, 2014, searchers needed a map of the southern Indian Ocean floor. They found that the area was almost blank. The search produced one of the largest single increases in deep-sonar coverage ever recorded, and it revealed new mountains, ridges, and volcanoes. The plane was not found, but the maps remain useful for science.
Case 3: Offshore Hawaii, November 2023. From November 7 to 17, the exploration ship E/V Nautilus surveyed deep water about 200 nautical miles south of Hawaii Island. As the Nautilus Live team explained in their expedition report, the area lies at about 5,000 metres deep. Nearby waters are well charted, but the expedition lead noted that many offshore areas remain completely unmapped. The same report states that the US Exclusive Economic Zone is larger than all 50 states combined, yet as of January 2023 only 50% of it was mapped beyond minimum standards.
Case 4: The Blake Plateau coral reef, announced with the 2024 grid. New mapping revealed a coral habitat of more than 6.4 million acres off the US Southeast coast. Teams confirmed it with images from 23 submersible dives. A reef that large had been hiding in plain sight until the sonar went over it.
Here is what these cases teach. A blank map hides risk, and it also hides value. Each time a ship fills a gap, it finds something useful, from a hazard to a habitat.
My Back-of-the-Envelope Math: Can We Hit 100% by 2030?
I like to test big goals with simple numbers. This is Sea Mystics’ own estimate, not an official forecast, and it uses the public figures above.
The 2026 update added about 5 million square kilometres, which is close to 1.4 percentage points in one year. About 71.3% of the seafloor is left, or roughly 258 million square kilometres. If the pace stays the same, finishing would take about 51 years, which points to the 2070s.
Now look at the 2030 target. Reaching 100% in about four years would need more than 17 points per year. Even the earlier UNESCO pledge of 80% would need nearly 13 points per year. That is about nine times the current speed.
The Devil’s Sea: Japan’s Own Version of the Bermuda Triangle
Here is a second check using ship time. A modern multibeam covers a strip about three to five times as wide as the water is deep. In 4,000 metres of water, that is roughly 12 to 20 kilometres. At 10 knots, a ship scans about 5,000 to 9,000 square kilometres per day. For 258 million square kilometres, the total comes to roughly 80 to 130 ship years of pure surveying, before counting transit, storms, and port stops.
| Scenario | Yearly gain needed | Compared with today |
|---|---|---|
| Current pace | About 1.4 points | 1 times |
| 80% by 2030 | About 13 points | About 9 times |
| 100% by 2030 | More than 17 points | More than 12 times |
The lesson is not to give up. The lesson is that the old way of mapping, one ship at a time, cannot close the gap alone. We need more uncrewed vessels, more shared data, and smarter targeting.
The Least Explored Ocean Areas on Earth
The least explored ocean is not one single place. It is a patchwork of regions with different reasons for the gaps. Here is a simple guide.
| Region type | Why it stays blank | What helps |
|---|---|---|
| Polar seas | Ice, storms, long distance | Icebreakers and uncrewed boats |
| Mid-ocean basins | Few ships, no commercial need | Crowdsourced data from passing vessels |
| Deep trenches | Pressure, depth, and cost | Autonomous underwater vehicles |
| Open southern ocean | Remote, rough weather | Partnerships between nations |
| Disputed waters | Legal barriers | Agreements and shared data |
Polar waters and the far southern ocean deserve special attention. Fewer ships pass through, and the weather is brutal. Yet these areas drive global currents and hold fragile ecosystems. A mapping gap there affects climate models for the whole planet.
Deep trenches face a different issue. They are narrow, so a satellite blur can hide them. They are also very deep, so only specialised vehicles can reach the bottom. Each new dive tends to show that the real shape differs from the old estimate.
What a Blank Map Hides: Sounds, Waves, and Mysteries
Unmapped ocean zones also feed our biggest ocean mysteries. When something strange happens far from shore, nobody can say which seamount or canyon shaped it. A good map helps rule out natural explanations and focus on real unknowns.
Take the odd sounds recorded by underwater microphones. NOAA’s hydrophones picked up the famous noise called Julia in 1999. Years earlier, in 1991, they heard the Upsweep sound in the Pacific. Another recording, known as the Slow Down sound, came from the same listening network. Sound travels far in deep water, and the shape of the seafloor changes how it bounces, so a better map helps researchers trace where it began. A similar story applies to the strange train sound in Antarctica, where ice and rock both play a part.
Other topics also rely on seafloor knowledge. The history of ocean nuclear testing depends on knowing exactly where blasts happened and how the seabed has changed. Reports of sunken city ruins often turn out to be natural rock formations that sonar can sort out in minutes. The region known as the Devil’s Sea near Japan sits over active volcanic terrain that deserves better charts. Even a rogue wave can depend on how currents meet the shape of the shelf.
In my experience reading survey tracks, the most exciting moments come when a ship crosses an area no one has scanned. The screen shows a clean, flat plain, and then a sharp peak rises out of it. That moment explains why I care about this work.
Why the Missing Maps Matter Beyond Curiosity
Mapping gaps affect real decisions. Here are the main reasons they matter.
- Navigation and safety: Charts keep submarines, cargo ships, and cable layers away from hidden peaks.
- Tsunami forecasts: The shape of the seafloor steers waves across the ocean, so rough maps give rough warnings.
- Climate science: Ridges and basins guide deep currents that move heat around the planet.
- Fisheries management: Seamounts and canyons attract fish, and managers need to know where they are.
- Habitat protection: Sensitive coral and sponge areas can only be protected once they are found.
- Cables and energy: Internet cables and wind farms need stable, well-known terrain.
The Nautilus team made a good point in the Hawaii report. Fragile structure-forming species such as deep-sea corals and sponges are very important to management agencies, and their location depends on seafloor data. A map is the first step, and the camera, sampling, and genetics come next. Without the first step, none of the others can start.
Sunken City Ruins: Real Underwater Cities Found Beneath the Sea
How Scientists Are Closing Mapping Gaps
The good news is that new tools are arriving. Here are the main steps researchers are taking right now.
- Pool all existing data. Seabed 2030 gathers surveys from governments, universities, and companies into the free GEBCO grid.
- Use ships of opportunity. Cargo and fishing vessels can carry simple sonar and log depth as they travel.
- Deploy uncrewed surface vessels. Small autonomous boats can stay at sea for weeks at lower cost than a crewed ship.
- Send autonomous underwater vehicles. These robots fly close to the bottom and capture sharper detail than a surface ship can.
- Improve satellites. Newer missions refine the broad picture and help pick targets for ship surveys.
- Target the biggest unknowns first. Planners use satellite maps to decide where a single ship day will add the most knowledge.
- Add biology to every mapping trip. Teams collect water samples for environmental DNA, so one voyage returns both depth and species data.
I want to stress the last point, because it changes the value of each trip. The Nautilus Hawaii expedition used a lander to collect water for eDNA, which detects animals from trace genetic material. That means a mapping cruise can also count fish, whales, and plankton. It turns a one-purpose trip into a full survey.
Practical Insights From Real Survey Work
After years of reading and planning ocean data, a few lessons come up again and again. These are my own working notes, and they apply to students, writers, and curious readers.
First, always check what “mapped” means in a headline. A figure of 100% coverage may refer to satellite estimates, not sonar. Look for words like “modern standards” or “multibeam” to know which one is meant.
Second, treat percentages with care. A region can count as mapped when it only has a few lines of sonar in it. The Nautilus report notes that minimum standards mean just one or two soundings in an area the size of a football field. That is enough for safe navigation, but not enough to study habitats.
Third, resolution matters as much as coverage. A 100 metre grid can hide a canyon, a vent field, or a shipwreck. When you read about a “new discovery,” ask what resolution made it possible.
Finally, expect surprises. Every time a new area is scanned in detail, someone finds a feature that was missing from the old picture. That pattern held true for the Indian Ocean after MH370, for the Blake Plateau, and for the deep water off Hawaii.
Frequently Asked Questions
How much of the ocean floor is mapped?
As of April 2026, 28.7% of the ocean floor is mapped to modern standards, according to the Seabed 2030 project. That equals about 104 million square kilometres. The rest has only coarse satellite estimates or no direct data.
Why are unmapped ocean zones so hard to survey?
Deep water weakens sonar signals, ships cost a lot to run, and many areas are far from ports. Weather, ice, and permits add more delays. Together, these problems slow every survey.
What is the least explored ocean region?
There is no single answer, but polar seas, mid-ocean basins, and deep trenches sit among the least explored. They are remote, expensive to reach, or very deep. Each one needs a different tool to survey.
Will the seafloor be fully mapped by 2030?
Most experts believe it will not. At the current pace of about 1.4 percentage points per year, full coverage would take decades. Faster methods, such as uncrewed vessels, could shorten that time.
What is the difference between satellite maps and sonar maps?
Satellites estimate depth from small changes in sea surface height, giving about 5 kilometres of detail. Sonar measures depth directly and can show features as small as tens of metres. Sonar is far more accurate, but it needs a ship or robot on site.
Can I see the map myself?
Yes. The GEBCO grid is free and open to the public. You can view it online and zoom in to see which areas are blank.
Conclusion
Unmapped ocean zones remain one of the biggest gaps in our knowledge of Earth. Progress is real, with coverage rising from about 6% in 2017 to 28.7% in 2026. Yet the math shows that the current pace will not finish the job by 2030. The problem is not a lack of interest. It is the cost of ships, the physics of deep water, and the sheer size of the ocean.
Still, every new survey proves the effort is worth it. A single cruise can reveal a coral reef, a hidden mountain, or a hazard that keeps ships safe. If you want to learn more, start with our complete guide to ocean floor mapping and explore more stories on the Sea Mystics homepage. The next big discovery is waiting in a part of the map that is still blank.
Test Your Knowledge: 5 Question Quiz
1. What share of the seafloor is mapped to modern standards as of April 2026?
a) 12%
b) 28.7%
c) 55%
2. What does a satellite measure to estimate seafloor shape?
a) Heat from the seabed
b) Tiny changes in sea surface height
c) Radio waves that pass through water
3. Which event caused the biggest jump in deep-sonar coverage in the Indian Ocean?
a) The search for Flight MH370
b) The sinking of the Titanic
c) A tsunami in 2004
4. At the current yearly gain of about 1.4 percentage points, roughly how long would full mapping take?
a) 5 years
b) 15 years
c) About 50 years
5. Why did the USS San Francisco accident happen in 2005?
a) A storm damaged the engine
b) The sub struck an uncharted seamount
c) The crew lost radio contact
Answers: 1) b, 2) b, 3) a, 4) c, 5) b
References
- Seabed 2030 Project, Global seabed mapping reaches new milestone (April 2026): https://seabed2030.org/2026/04/20/global-seabed-mapping-reaches-new-milestone-as-five-million-square-kilometres-added-in-a-year/
- International Hydrographic Organization, Global seabed mapping reaches new milestone (April 2026): https://iho.int/en/global-seabed-mapping-reaches-new-milestone-as-five-million-square-kilometres-added-in-a-year
- Nautilus Live, Addressing Unmapped Gaps Offshore of the Hawaiian Islands (November 2023): https://nautiluslive.org/blog/2023/11/07/addressing-unmapped-gaps-offshore-hawaiian-islands
- EarthDate, Our Unmapped Ocean: http://www.earthdate.org/episodes/our-unmapped-ocean
- UNESCO IOC, Seabed 2030 announces latest progress: https://www.ioc.unesco.org/en/articles/seabed-2030-announces-latest-progress-world-hydrography-day